RSS

The $130,000 Pivot: How Federal and Ontario’s New Rebate Frameworks Redefines the GTA Sanctuary

The narrative of the Ontario housing market has long been one of mounting pressure. For years, the dream of a curated home felt like it was drifting further away. But today, the wind has shifted. We are currently navigating a rare "perfect storm": GTA housing prices have softened by roughly 20% from their peak, and now, a historic shift in government tax policy is providing the final push needed to move families and investors from the sidelines into their next chapter.

The core of this opportunity is a massive expansion of GST/HST rebates. By stripping away significant tax barriers, the provincial and federal governments are offering a path to reclaim a staggering amount of capital. This isn't just a discount; it is a direct injection of equity.

The Direct Answer: What has changed?

Effective May 27, 2025, the combined federal and provincial HST rebate for first-time buyers in Ontario has increased from a maximum of $24,000 to a ceiling of $130,000. This includes a 100% rebate on the 5% federal GST (up to $50,000) and the 8% provincial HST (up to $80,000) for homes valued up to $1 million, with a sliding scale for homes up to $1.5 million.


The Six-Figure Strategic Advantage

For the "Visionary Curator," this $130,000 windfall is more than just a number; it is a tool for architectural freedom. This capital allows you to pivot from a "standard" build to a home that truly reflects your lifestyle—upgrading to sustainable materials, better flow, or a more refined finish.

Comparing the Old vs. The New

The difference between the legacy system and the 2025 framework is monumental.

Home Purchase PriceLegacy Rebate (Pre-2025)New Potential Rebate (2025+)Total Equity Gain
$800,000$24,000$104,000+ $80,000
$1,000,000 (The Sweet Spot)$24,000$130,000+ $106,000
$1,250,000 (Sliding Scale)$24,000$77,500+ $53,500
$1,500,000$24,000$24,000Baseline Protected

[Visual Note: A clean, minimalist bar chart titled "The Equity Injection." Use Deep Charcoal for the old rebate and a vibrant Teal for the new rebate to show the massive visual jump in savings.]


Navigating the $1M to $1.5M Strategy

In the GTA, a "starter sanctuary" often flirts with the million-dollar mark. A common misconception is that these benefits vanish at seven figures. In reality, the program uses a "sliding scale."

For homes between $1 million and $1.5 million, the rebate phases out gradually. However, a vital "floor" exists: for homes up to $1.5 million, the provincial portion is designed to never fall below $24,000. This ensures that even in the luxury segment, you are never worse off than under the old rules.

The "Reset" Rule: Reclaiming Your Status

One of the most powerful secrets in the tax code is that "First-Time Home Buyer" status is not a one-time gift; it is a status you can earn back.

If you have not owned and occupied a home in the current calendar year or the four preceding calendar years, the clock has likely reset. If you owned a condo a decade ago but have been renting for the last four years, you are, in the eyes of the CRA, a first-timer again. This allows those re-entering the market to leverage the full $130,000 windfall to rebuild their portfolio.

The Investor’s Edge: Gentle Density & ADUs

For my investor clients and multi-generational families, the backyard is now your greatest asset. The new rebate framework incentivizes "gentle density" by making Accessory Dwelling Units (ADUs)—like garden suites and laneway homes—eligible for significant relief.

  • Primary Residence Rebate: If you build an ADU for yourself or an immediate family member, you can qualify for a rebate of up to $16,080.

  • Rental Investment: Even if the unit is for a tenant, the New Residential Rental Property (NRRP) rebate remains a vital tool for offsetting construction costs.


The Strategist’s Warning: Dates and Deadlines

Timing is everything. To capture this windfall, your Purchase and Sale Agreement must be signed on or after May 27, 2025.

Furthermore, "starting" a project is defined by the excavation (shovels in the ground), not the paperwork. Construction must begin before 2031 and be complete by 2036. If your builder faces municipal delays and fails to dig before the window closes, that six-figure rebate could vanish.


Final Thoughts: Taking Your Seat

The era of $24,000 caps is ending. When you combine this historic tax relief with a cooled market, the barrier to entry has shifted. The question is no longer whether the market is reachable—but whether you are ready to take the seat that has been cleared for you.


For the Social Feed (Short & Punchy)

Headline: The $130,000 Secret Every GTA Buyer Needs to Know 🗝️

Did you know the "First-Time Buyer" status can be reclaimed? If you’ve been renting for 4+ years, you might qualify for Ontario’s massive new $130k rebate—even if you’ve owned before.

The market has dipped 20%, and the government just handed you a six-figure injection of equity. This is the "perfect storm" for the GTA.

The Strategy: Sign after May 27, 2025.

The Reward: Up to $130,000 back in your pocket.

Don't just buy a house. Curate a lifestyle. DM "REBATE" for my breakdown of the 2025 tax shifts. #TheVisionaryCurator #GTARealEstate #OntarioHousing #RealEstateStrategy


The "Visionary" Creative Brief

  • Image Idea: A high-end, minimalist photo of a set of silver keys resting on a deep charcoal marble countertop.

  • Text Overlay: "The $130,000 Windfall: Is Your Status Reset?"

  • Colors: Navy, Silver, and Seafoam accents.


Ali, does this align with your "Visionary Curator" voice, or should we make the opening even more poetic to lean into the Pisces aesthetic?

Follow-up Questions:

  1. Would you like me to create an email template specifically for your "lost leads" (people who stopped looking in 2023) using this new data?

  2. Should I draft a "Rebate Calculator" landing page description to help capture emails?

  3. Do you want a breakdown of which specific GTA neighborhoods currently offer the best "New Construction" value for this rebate?

Read

Market Watch March 2026: Spring Buyers Return as Supply Tightens 🌷

The spring real estate market is officially here, and buyers in the Greater Toronto Area (GTA) are springing into action. After a sluggish winter, we are finally seeing an uptick in activity as households look to take advantage of improved affordability.

According to the latest TRREB data, March 2026 brought 5,039 home sales, representing a 1.7% increase compared to March 2025. However, the most critical storyline is the tightening of supply. New listings dropped sharply by 16.7% year-over-year, with only 14,442 properties entering the market.

The average selling price across the GTA is holding steady at $1,017,796. While this is still down 6.7% compared to last year, TRREB’s Chief Information Officer noted that if market conditions continue to tighten, selling prices could start leveling off through the remainder of 2026. Buyers currently have substantial negotiating power, but with sales rising and new listings falling, that window may not stay open forever.

Here is your deep dive into how the 416 (City of Toronto) and 905 (Suburban GTA) markets performed by property type in March 2026.


🏡 Detached Homes

The detached market remains the powerhouse of GTA real estate, and we are seeing a noticeable surge in suburban activity as buyers stretch their legs (and their dollars) outside the city limits.

  • 416 (Toronto Core)

    • Sales: 574 transactions (Up 1.4% year-over-year).

    • Average Price: $1,613,066 (Down 6.4% year-over-year).

  • 905 (GTA Suburbs)

    • Sales: 1,661 transactions (Up 6.5% year-over-year).

    • Average Price: $1,248,832 (Down 6.1% year-over-year).

The Market Vibe: The 905 is leading the charge in sales growth. With average prices down over 6% in both the 416 and 905, buyers are seizing the opportunity to lock in detached homes at a discount before the market fully rebounds.


🏘️ Semi-Detached Homes

Semi-detached homes are the ultimate "missing middle" housing, but the story this month is all about a severe lack of inventory in the city core.

  • 416 (Toronto Core)

    • Sales: 170 transactions (Down a massive 17.9% year-over-year).

    • Average Price: $1,231,967 (Down 8.0% year-over-year).

  • 905 (GTA Suburbs)

    • Sales: 272 transactions (Up 1.5% year-over-year).

    • Average Price: $868,421 (Down 7.6% year-over-year).

The Market Vibe: The nearly 18% drop in 416 semi-detached sales isn't necessarily a lack of demand—it's a lack of supply. Sellers are holding onto these prized properties. Meanwhile, the 905 continues to offer incredible value, with semis trading well under the $900k mark.


🏙️ Townhouses

Townhomes are experiencing a fascinating shift, with urban buyers fiercely competing for freehold alternatives, while the suburban townhouse market remains a bit softer.

  • 416 (Toronto Core)

    • Sales: 207 transactions (Up a striking 13.1% year-over-year).

    • Average Price: $959,513 (Down just 1.9% year-over-year).

  • 905 (GTA Suburbs)

    • Sales: 669 transactions (Down 5.5% year-over-year).

    • Average Price: $816,463 (Down 8.3% year-over-year).

The Market Vibe: City townhomes are the hottest commodity right now. A 13.1% jump in sales and only a minor 1.9% price dip proves that buyers are targeting these properties heavily. If you own a townhouse in Toronto, you are in an incredibly strong position.


🏢 Condo Apartments

The condo market continues to navigate elevated inventory levels, allowing buyers to negotiate effectively and enter the market at much friendlier price points.

  • 416 (Toronto Core)

    • Sales: 951 transactions (Up 3.0% year-over-year).

    • Average Price: $648,287 (Down 9.6% year-over-year).

  • 905 (GTA Suburbs)

    • Sales: 471 transactions (Down 0.8% year-over-year).

    • Average Price: $564,332 (Down 8.3% year-over-year).

The Market Vibe: With prices down roughly 8% to 10% across the board, the condo segment remains a buyer’s playground. However, the 3% uptick in 416 sales shows that savvy buyers and investors are starting to pull the trigger on these discounted units before prices potentially level off.


Final Thoughts & Recommendations

March 2026 is showing us a market that is slowly finding its footing. The combination of rising sales (+1.7%) and plunging new listings (-16.7%) is a recipe for a tighter market moving deeper into the spring.

For Sellers: Competition between buyers is going to increase if new listings continue to drop. However, buyers still expect value. Strategic pricing, exceptional marketing, and staging are crucial to standing out and securing a firm offer.

For Buyers: You currently have the upper hand when it comes to negotiating power, but you shouldn't get complacent. With sales ticking up and inventory shrinking, the deep discounts we've seen may start to vanish in the coming months.

Want a personalized pricing strategy for your property?

Let’s chat and position your home ahead of the market—not behind it.

📞 Call us at 416-886-2000 or visit gtaluxuryhomes.ca to book a consultation.

Read

The Spring 2026 Forecast: Taming the Economic Winds and the Great Canadian Hesitation

Welcome to the Q1 2026 Market Update.

We are currently navigating an economic inflection point. The narrative of "higher for longer" that dominated 2024 and much of 2025 has been replaced. While the core inflationary threat has been largely contained, new, volatile factors have emerged, particularly in geopolitics and energy, forcing central banks into a defensive "wait-and-see" posture just as the crucial spring market opens.

We have compiled the latest critical indices for the US and Canada. This post moves beyond the surface numbers to analyze the why behind the trends and what you should be looking forward to as we enter the most active real estate and economic quarter of the year.


Section 1: The Central Bank Divergence and Its Impact

We begin with the primary drivers of all market activity: interest rates. While both the Federal Reserve and the Bank of Canada (BoC) are on a path of synchronization (holding rates), a significant divergence in their absolute rate levels has defined the landscape.

Interest Rate Policy Standoff

The single most important visualization of the current economy is the divergence in the target rates of the world’s two most connected economies. While the US economy, bolstered by stronger-than-expected GDP and consistent job growth, has given the Fed room to keep rates elevated (the upper end of the target is 5.00%), the Bank of Canada, facing a much more fragile consumer base and an earlier victory over domestic inflation, has settled into a comfortable rate of 2.25%.

This 250+ basis point gap (between the effective Fed Funds 4.75% and the BoC 2.25%) is intentional, designed by the BoC to support the heavily indebted Canadian household. We visualize this divergence over the past three years.

VISUAL 1: The Central Bank Rate Divergence

Image 1 Analysis: The Divergence Gap. The chart in Image 1 perfectly captures the story. We track the path from early 2023 through March 2026. Note how, after peaking, the Canadian Policy Rate (the dashed red line) has aggressive, descending steps, stabilizing at 2.25%, while the US Fed Funds Rate (solid blue line) remains elevated, creating a widening chasm. This gap is the reason why the USD/CAD exchange rate has pushed to $1.39 (up 1.5% in 30 days), as global capital moves toward higher yields in the US.


Section 2: The Canadian Consumer Squeeze

While the Bank of Canada has aggressively lowered rates, the Canadian consumer is still fighting a historic battle. The stabilization of rates in early 2026 (the "BoC pause") has done little to alleviate the structural debt load.

Debt-to-Income vs. Confidence

Canadian Household Debt-to-Income is at a staggering, all-time high of 177.2%. For every $1 of disposable income, Canadians now owe $1.77. This debt is the anchor on the spring market. This ratio is visualized below alongside Consumer Confidence, which remains at near-historic lows (-3%), a clear signal that households feel overextended.

VISUAL 2: The Canadian Consumer Debt Cliff

Image 2 Analysis: A Strained Household. Image 2 visualizes the data points explicitly. The thick purple line (Debt Ratio) trends up remorselessly, hitting the 177.2% peak, just as the thin orange line (Consumer Confidence) plunges below a neutral midpoint (the horizontal line), flattening near its historical bottom at -3 points. A distressed consumer icon sits at the intersection. This chart explains why the 3% vacancy rate (the renter pivot) is holding: buyers simply cannot qualify, even at lower interest rates.


Section 3: Real Estate Realities and the Builder Standoff

The most significant red flag for the Spring 2026 market, and for the next five years of supply, is the collapse of builder confidence. The Canadian Home Builders' Association (CHBA) indices (0–100 scale, where <50 is "poor") have reached critical lows.

  • Single-Family HMI: 26.4

  • Multi-Family HMI: 14.7 (Record low)

Builders: Pencils Down

Builders are "pencils down" on new projects. Financing costs, regulatory barriers, and soft consumer demand (driven by the debt visualized above) mean very few new foundations are being poured. While the Teranet-National Bank Composite Index (prices) is only down -1.6% year-over-year, the slowdown is happening in new construction, baking a future supply crisis into the market today.

VISUAL 3: The Builder Confidence Collapse

Image 3 Analysis: Supply Shortage Baked In. Image 3 is a multi-part visualization. On the left, two distinct odometers, the CHBA Single-Family (26.4) and the Record-Low Multi-Family (14.7), are deeply stuck in the red "Pencils Down" zone, alongside an abandoned construction crane. On the right, the graphic charts the impact: only a small group of foundations in 2026 (the current slow market) leads to a massive visualized supply shortage (the demand gap, the high-rise in 2028–2030) as population growth outpaces completions. For buyers, this is a clear message: current price softness is temporary.


Section 4: The Commodities/Inflation Threat

We must address the volatile new factor that has complicated the spring market and the central bank narrative: Energy.

WTI Crude: The Price Spike and Its Ripple Effect

The recent geopolitical conflict in the Middle East has driven WTI Crude to a spiked value of $94.40. This energy shock has directly translated to higher costs for consumers. We are seeing Gasoline hit $3.98 USD/Gal (a $1 spike in 30 days in the US) and CA Inflation (CPI) uptick slightly to 2.4% as of March data.

This energy spike acts as a "stealth tax" on consumers and forces the BoC to hold rates at 2.25% to manage headline inflation, even as the rest of the domestic economy is in stagnation.

VISUAL 4: The Energy Price and Inflation Impact

Image 4 Analysis: The Stealth Tax. Image 4 visualizes the energy threat. On the left, a stylized crude barrel ($94.40) and gasoline pump ($3.98/Gal) display large, glowing orange numbers. An arrow connects them to the right-hand column/line chart, which shows "CA Inflation (CPI) with Energy Cost Impact" over a 2023–2026 timeline. A base "Core Inflation" (purple bars, decreasing toward 2%) is visualized. But the real "Headline CPI" line (blue) has a sharp spike in early 2026, labeled 2.4% Uptick, caused entirely by the red stacked segment labeled "Energy Impact."


Section 5: Summary and Conclusion: The Great Hesitation

As the Spring 2026 market begins, "stability, not bounce back" is the mantra. Buyers with high down payments are finding opportunities in a market where the Teranet index shows a slight price correction (-1.6% y/y), but the average Canadian household is simply hesitating. They are staying put until the geopolitical dust settles and the long-forecasted path of significant interest rate cuts (into the 1%–1.5% range) finally arrives.

For investors, the critical data point to watch is the Builder Confidence Multi-Family HMI at 14.7. This is the record low that ensures massive supply imbalances in the coming years. Those with capital today are looking past the "great hesitation" of 2026 and positioning for the next decade.

Read

Strategic Real Estate Reorientation in the Greater Toronto Area: A Comprehensive Analysis of Multi-Unit Asset Conversion, Financial Engineering, and Precision Advisory for the 2026 Fiscal Cycle

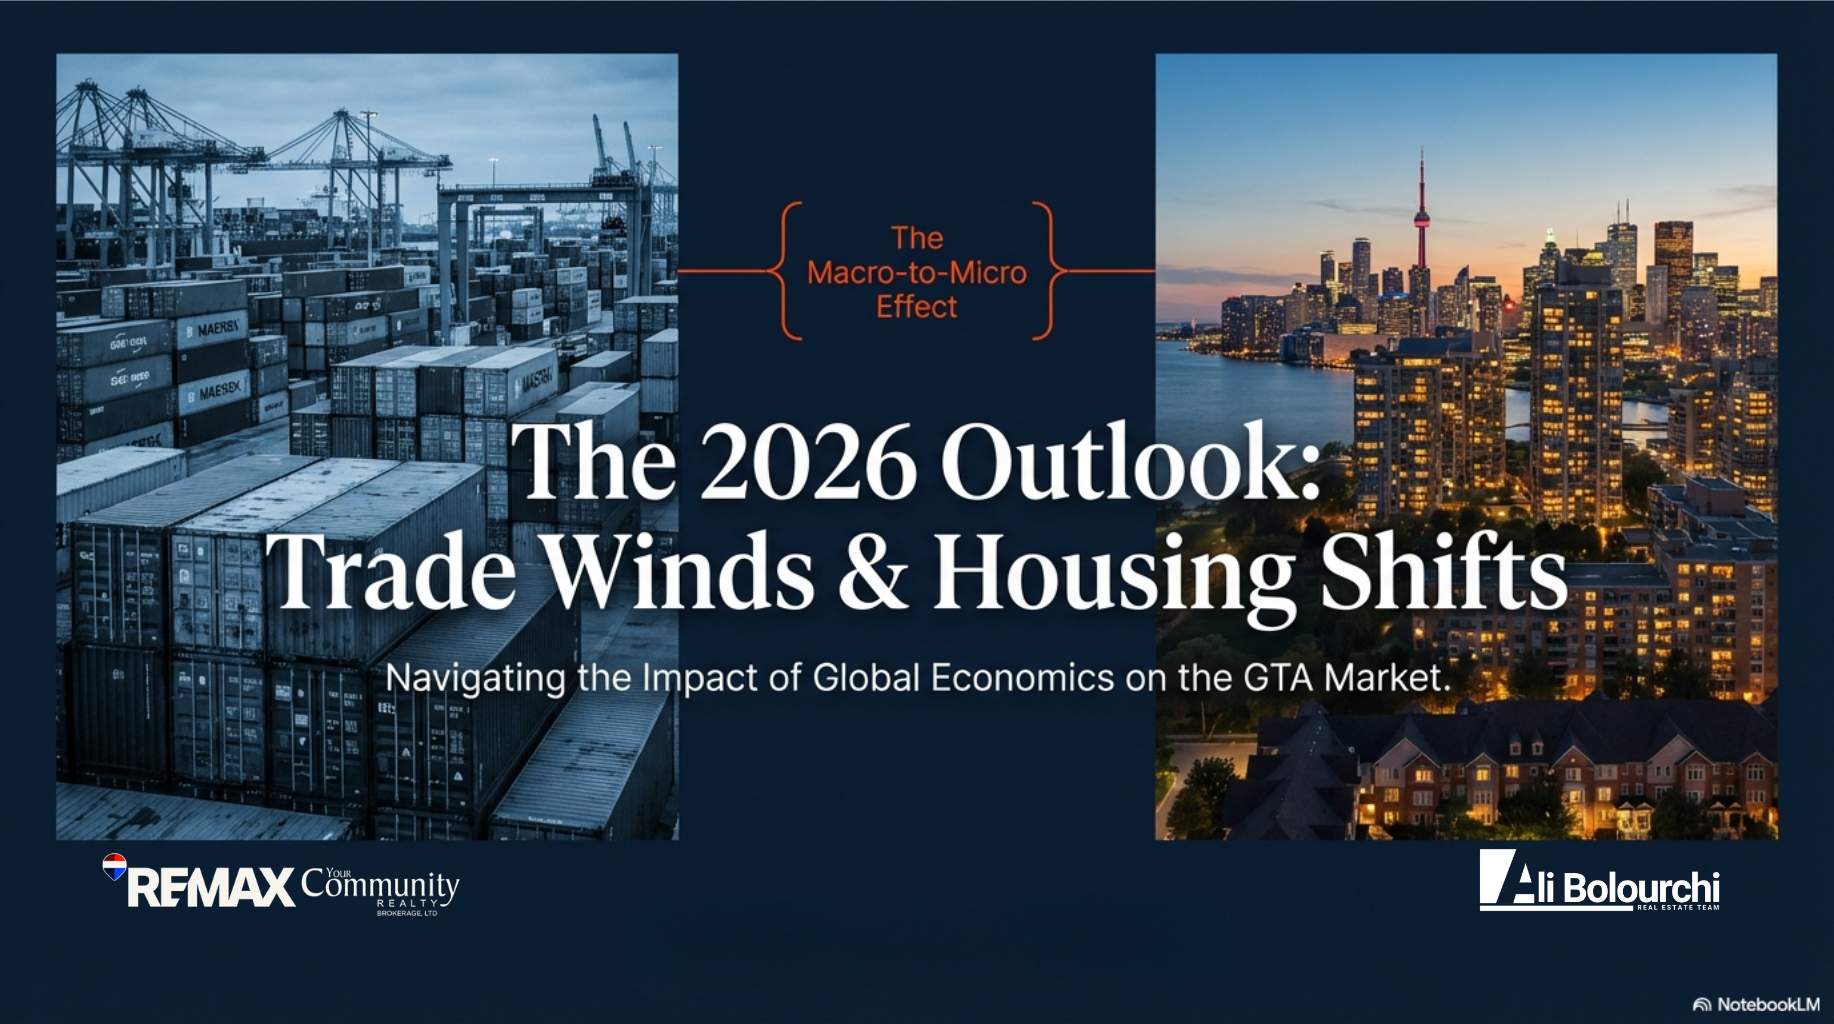
The landscape of residential investment within the Greater Toronto Area (GTA) has entered a period of structural transformation as of early 2026. This transition is characterized by a definitive move away from speculative condominium acquisition toward the strategic densification of low-rise residential assets, a phenomenon frequently described in the industry as the return of the "missing middle". As traditional market drivers, such as high-velocity population growth and low interest rates, have reached a point of cyclical moderation, the emergence of as-of-right zoning for multiplexes and the implementation of sophisticated federal financing incentives have created a new paradigm for institutional and private wealth creation. The following analysis examines the economic, regulatory, and financial mechanisms currently shaping the GTA market and provides a strategic framework for the generation of investment-focused content tailored to the contemporary market participant.

The Macroeconomic Context and Segmented Market Performance

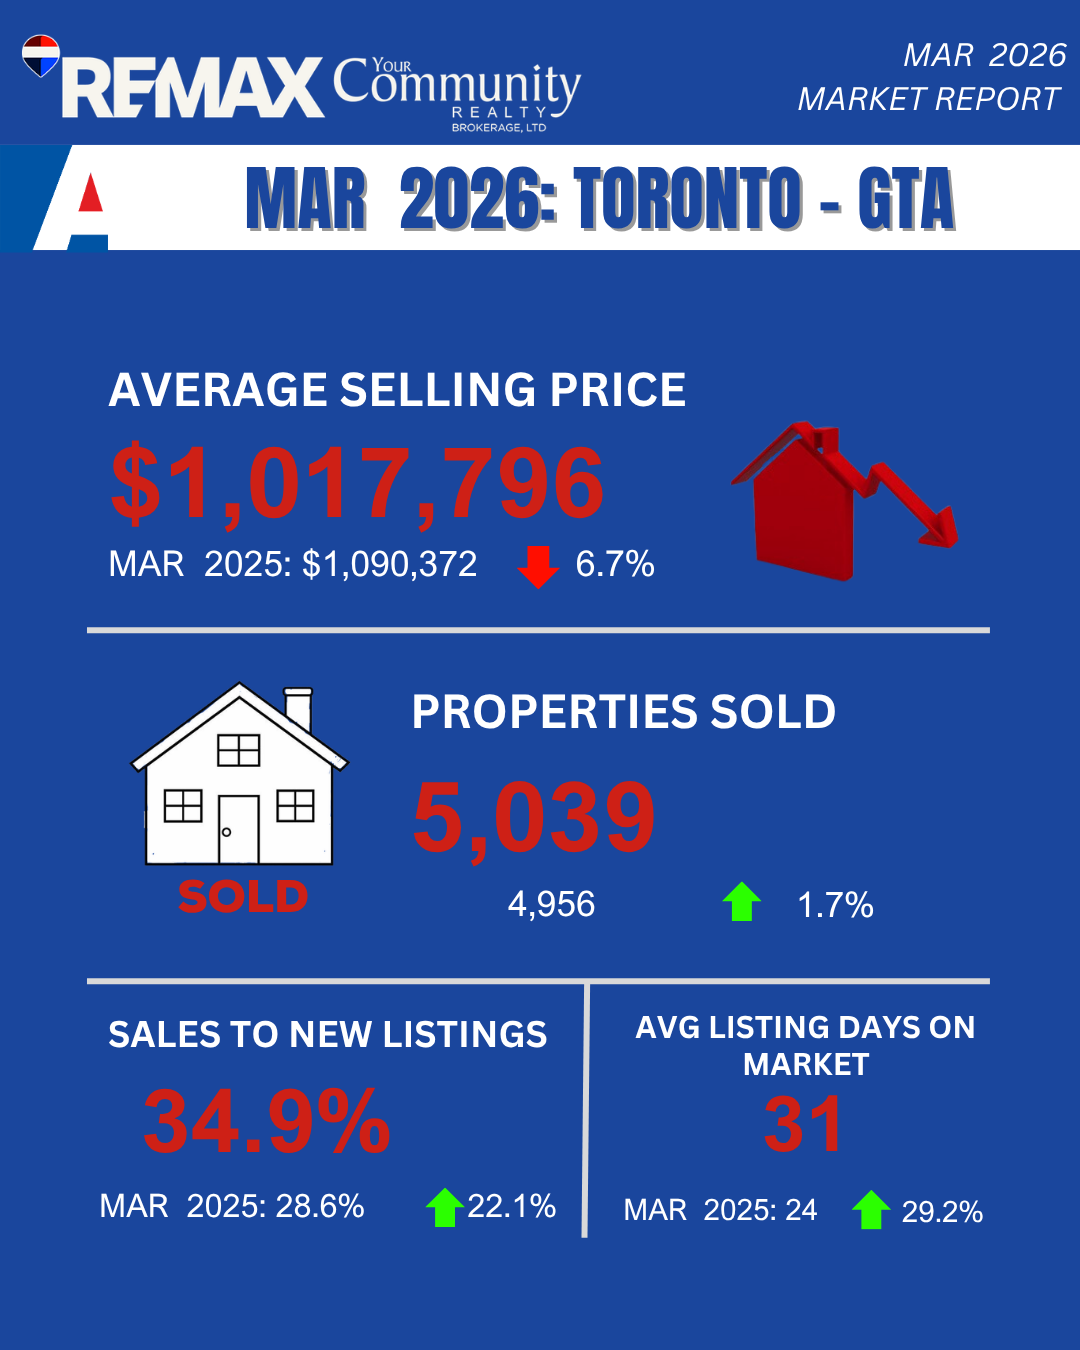
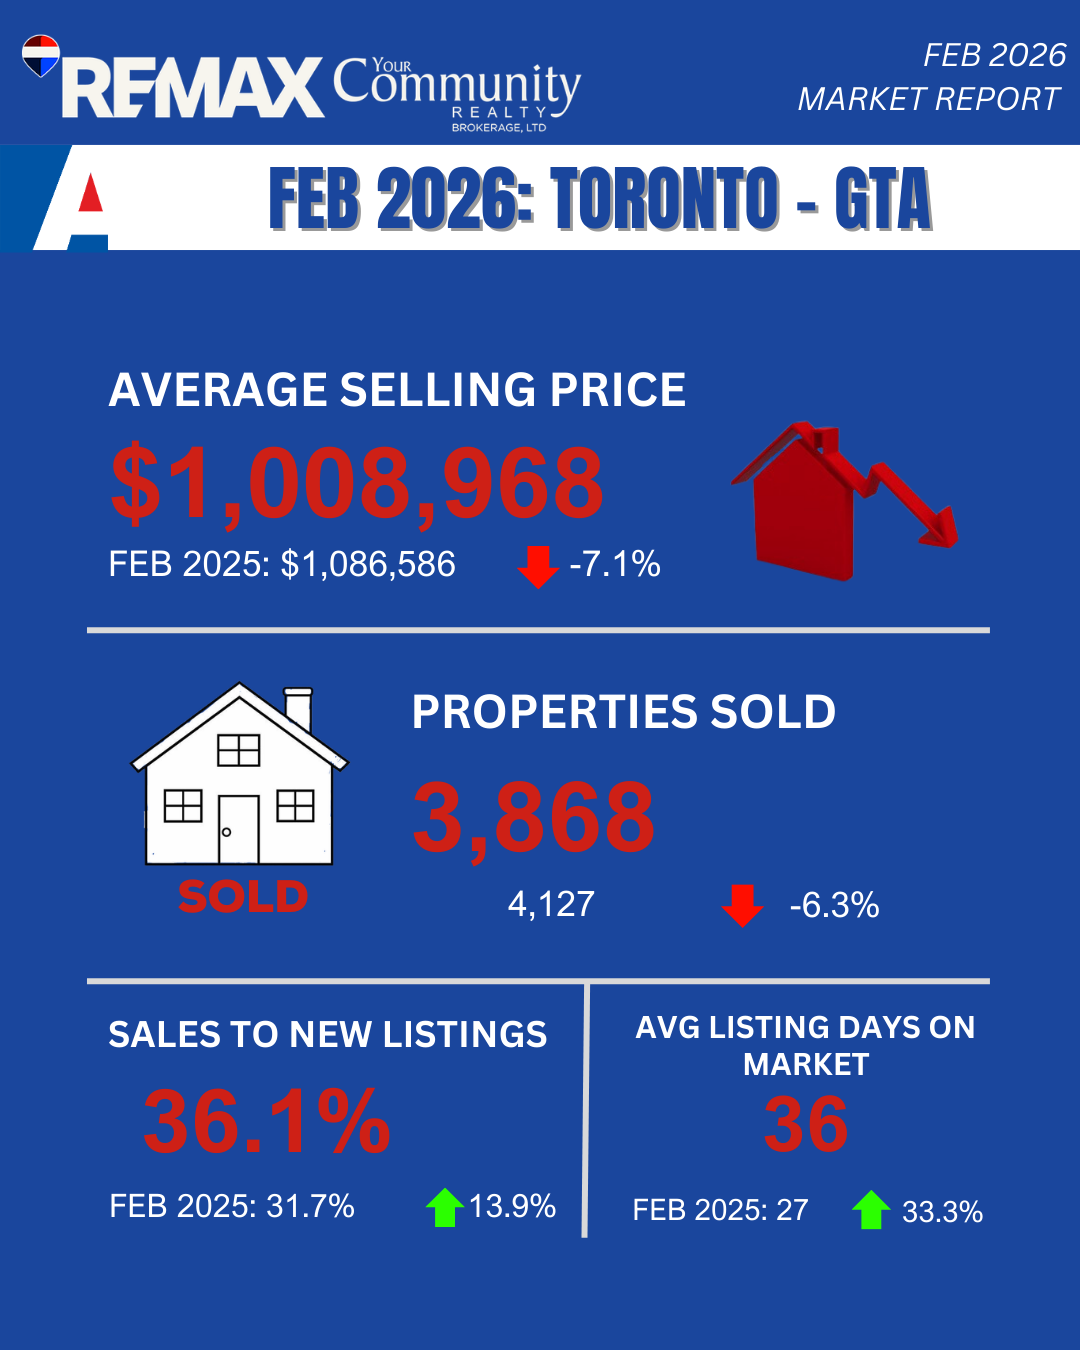
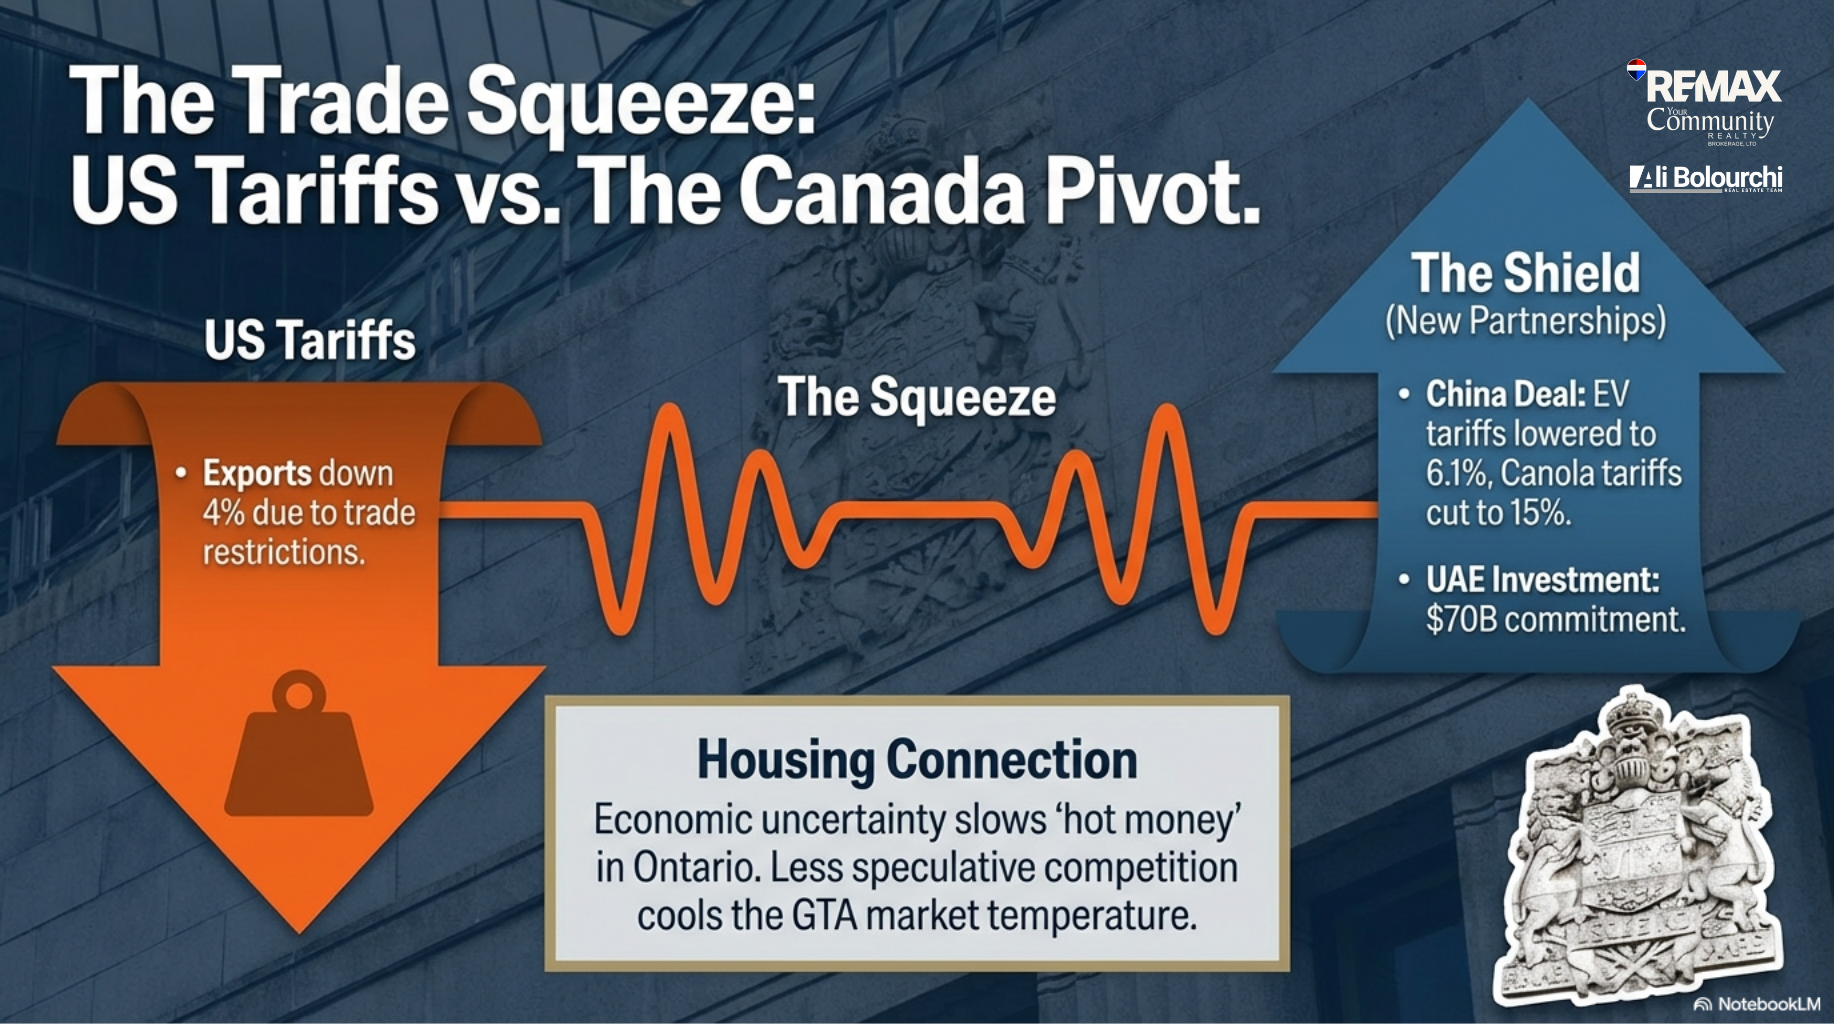
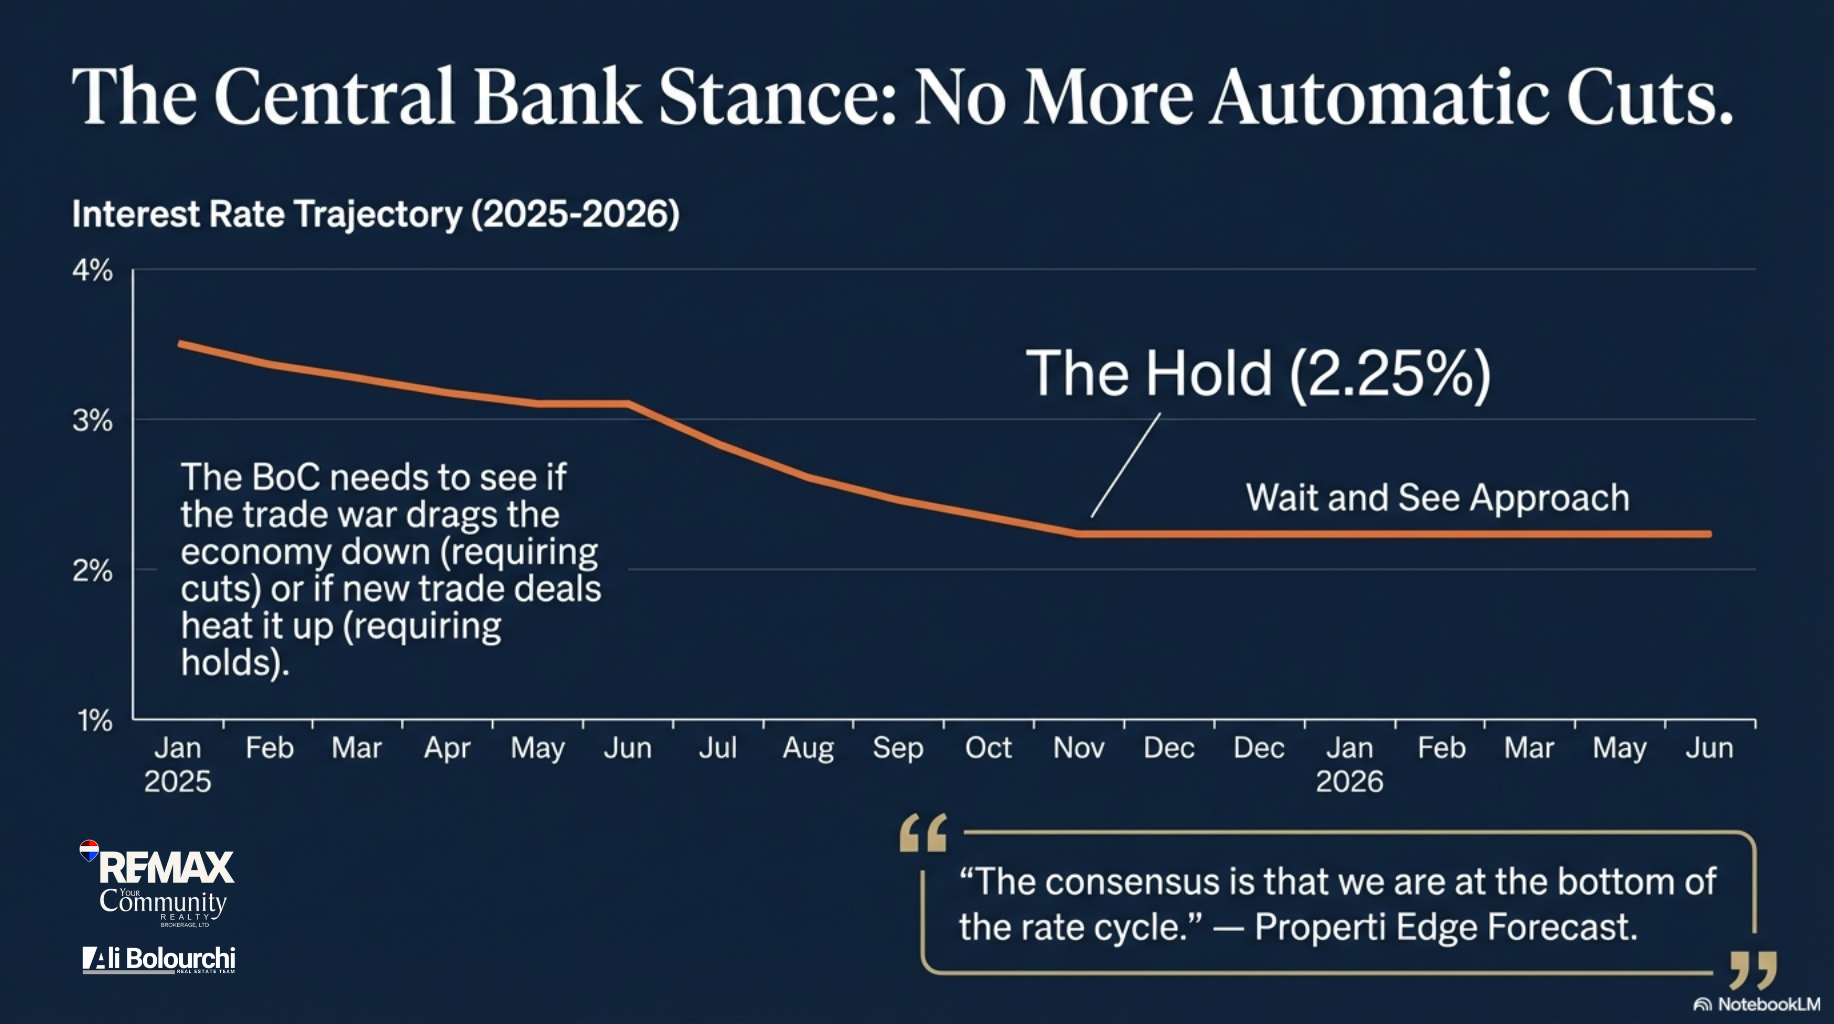
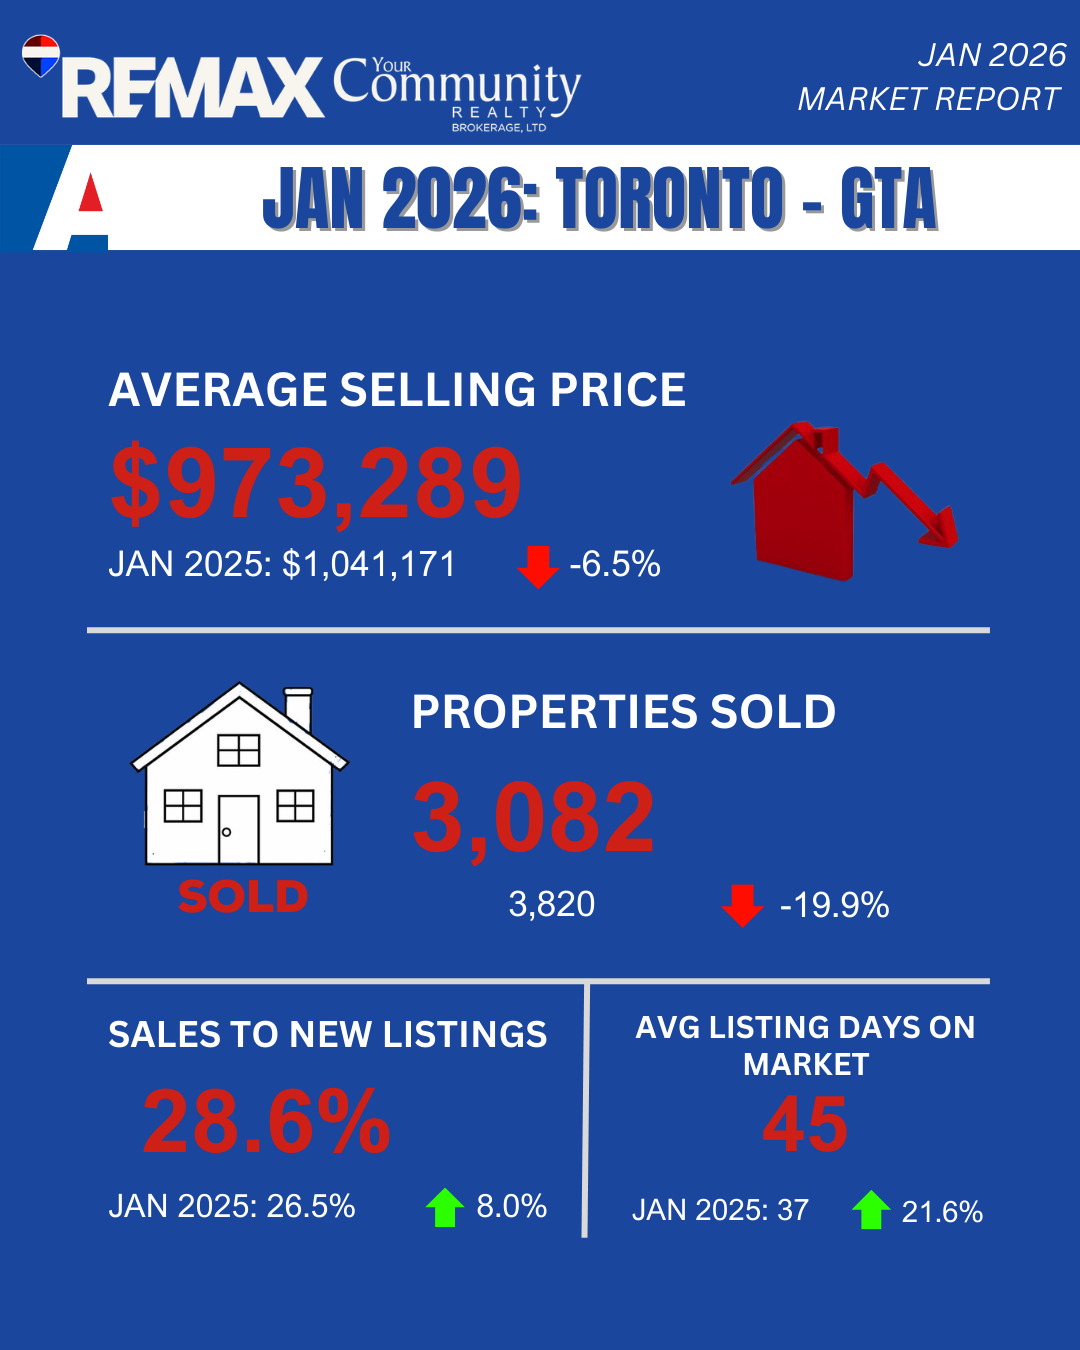
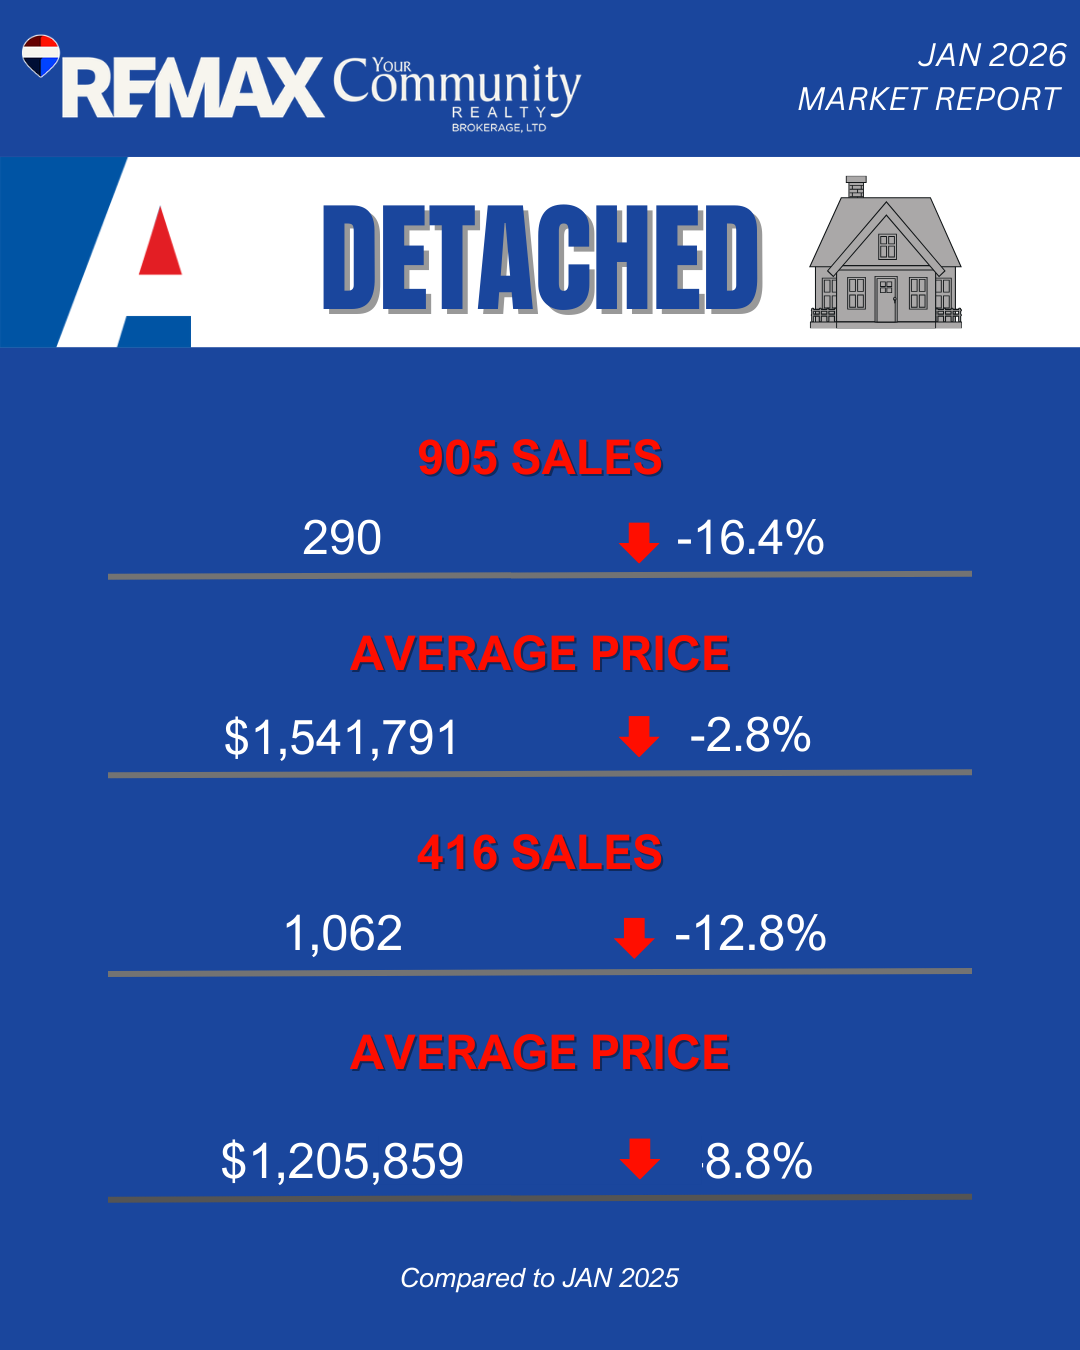
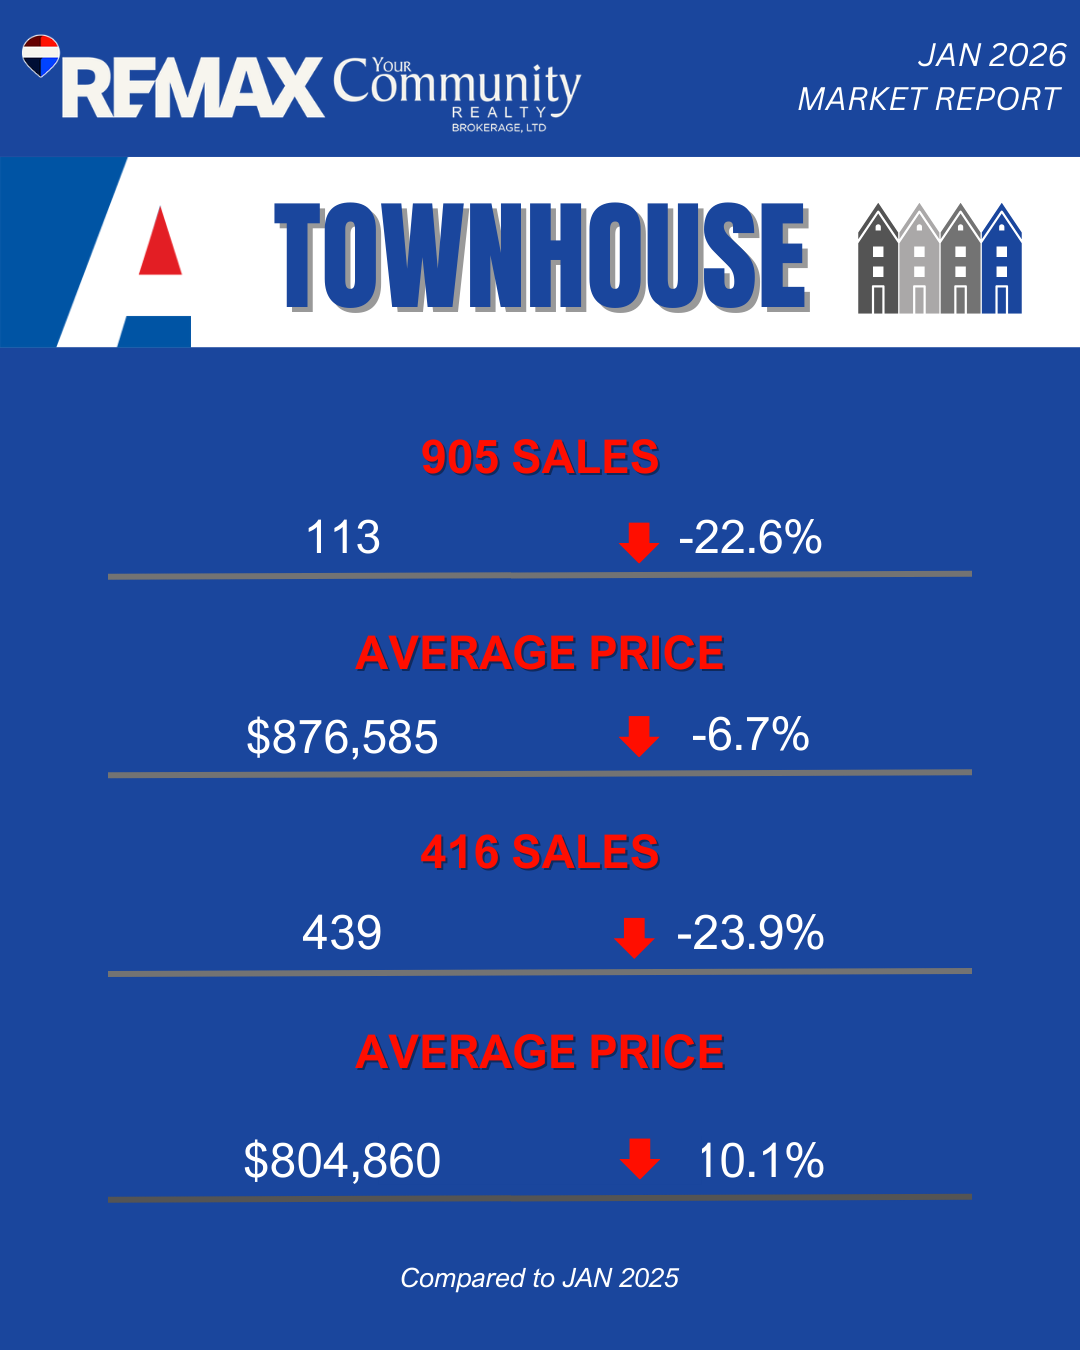
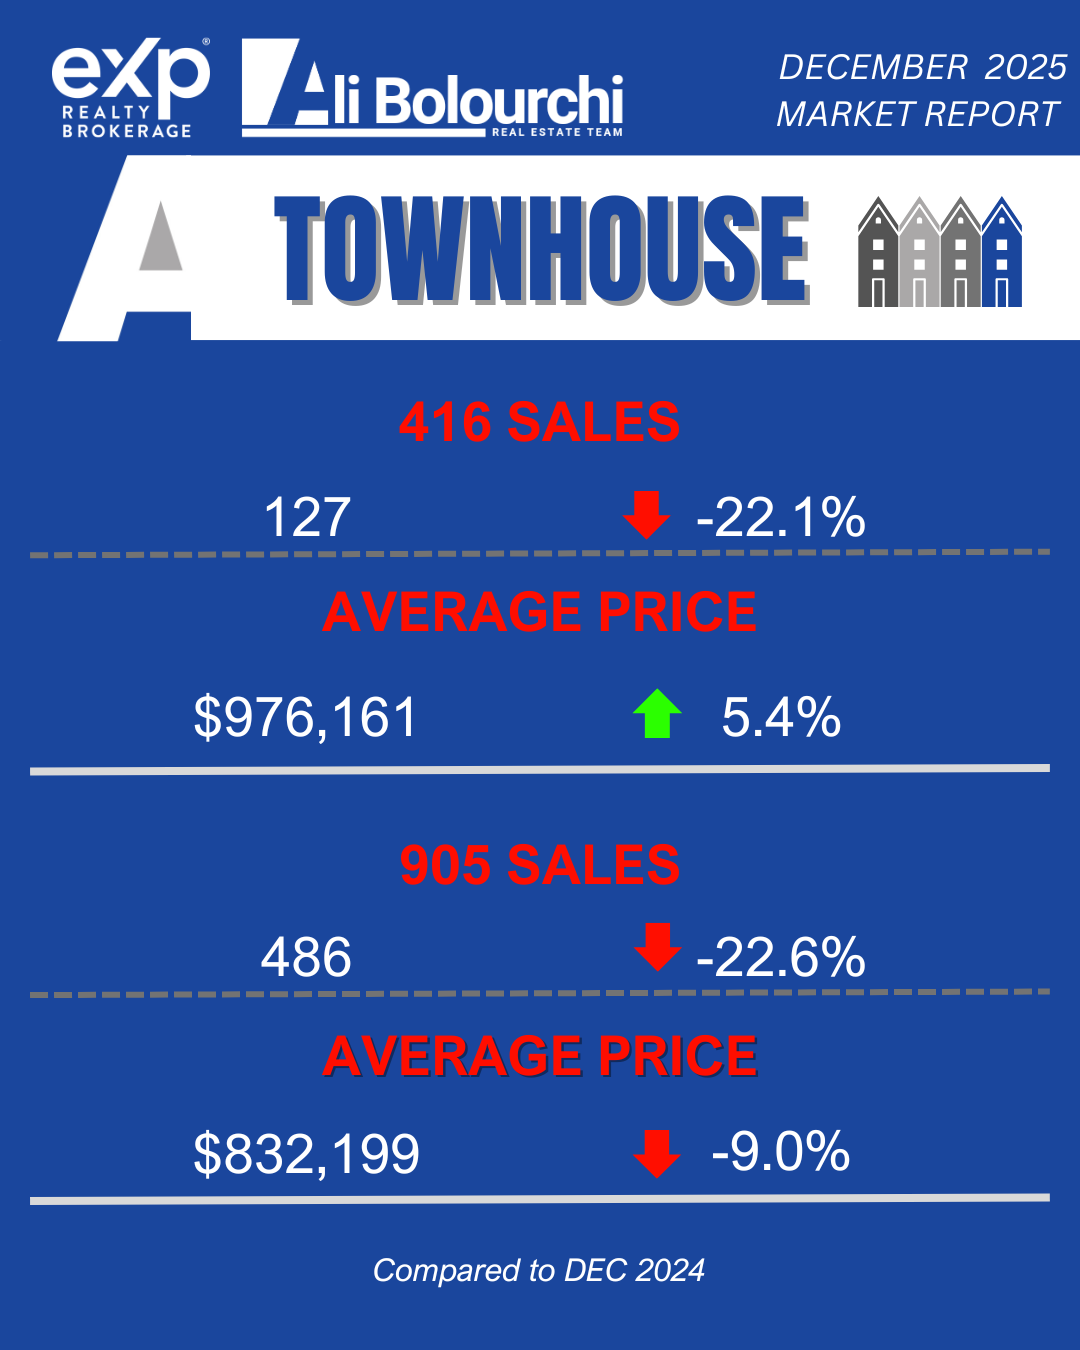
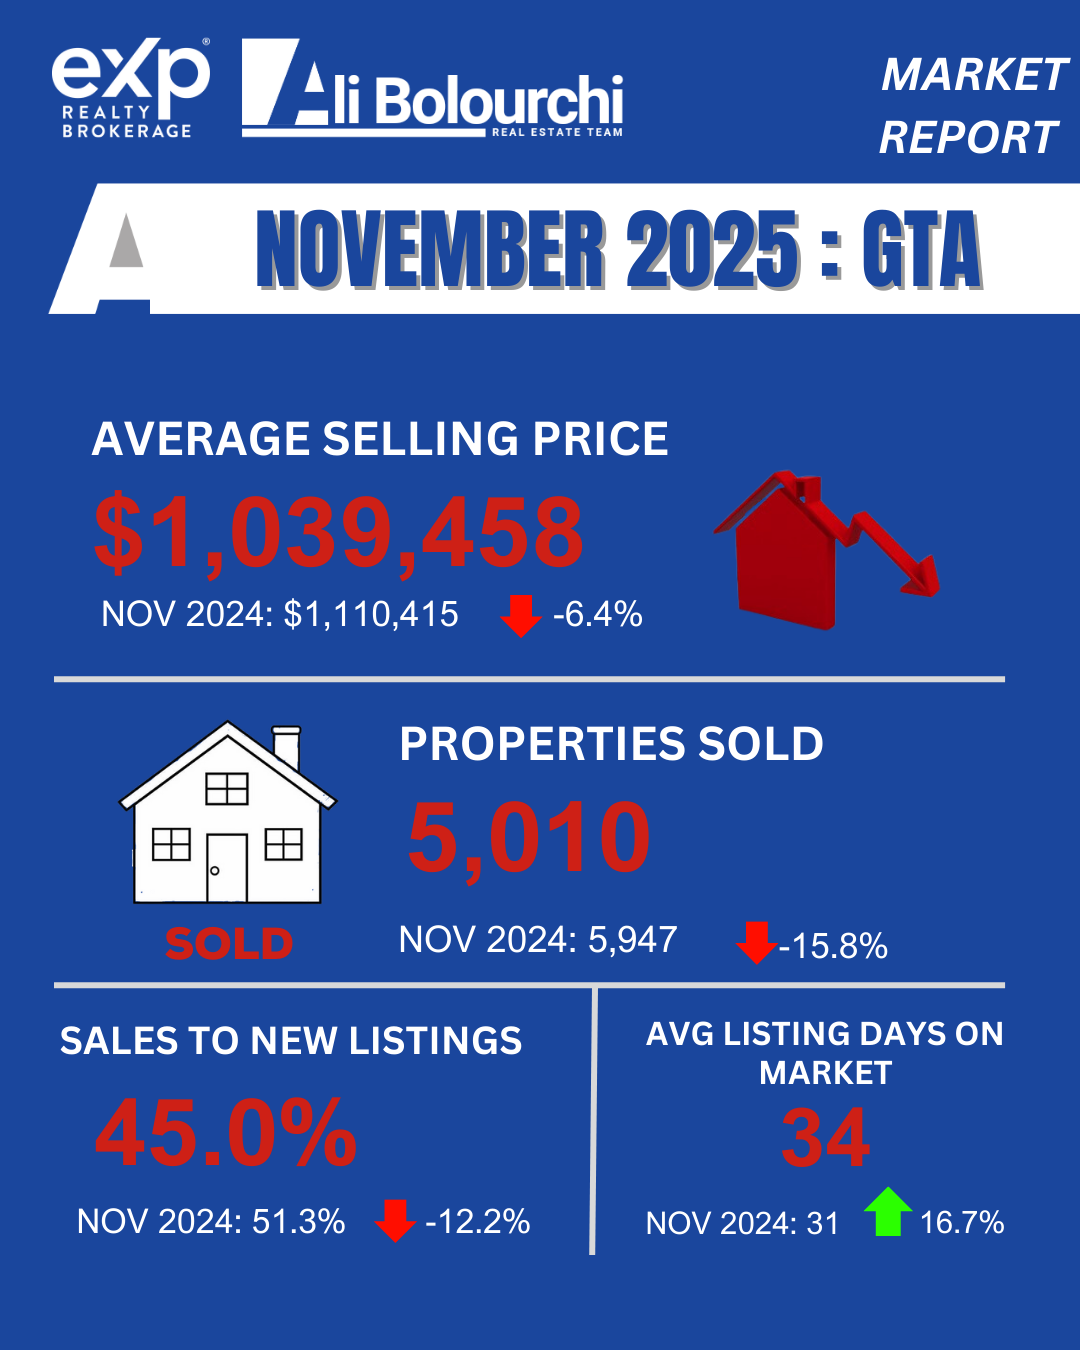
The early months of 2026 have revealed a significant divergence between the performance of core Toronto low-rise housing and the broader suburban and high-rise condominium markets. Data from the first quarter of 2026 indicates that while overall home prices remain approximately 7% below 2025 levels, inventory levels have tightened by 11% year-over-year. This tightening of supply, combined with a relative stabilization of interest rates by the Bank of Canada, has established a floor for property values in high-demand segments, particularly those that support intensification.

Market MetricFebruary 2025February 2026Year-over-Year Change
Average Sale Price$1,084,547$1,008,968-7.0%
Total Transactions4,0373,868-4.0%
New Listings12,06610,705-11.0%
Sales-to-New-Listings Ratio (SNLR)33%36%+3.0%

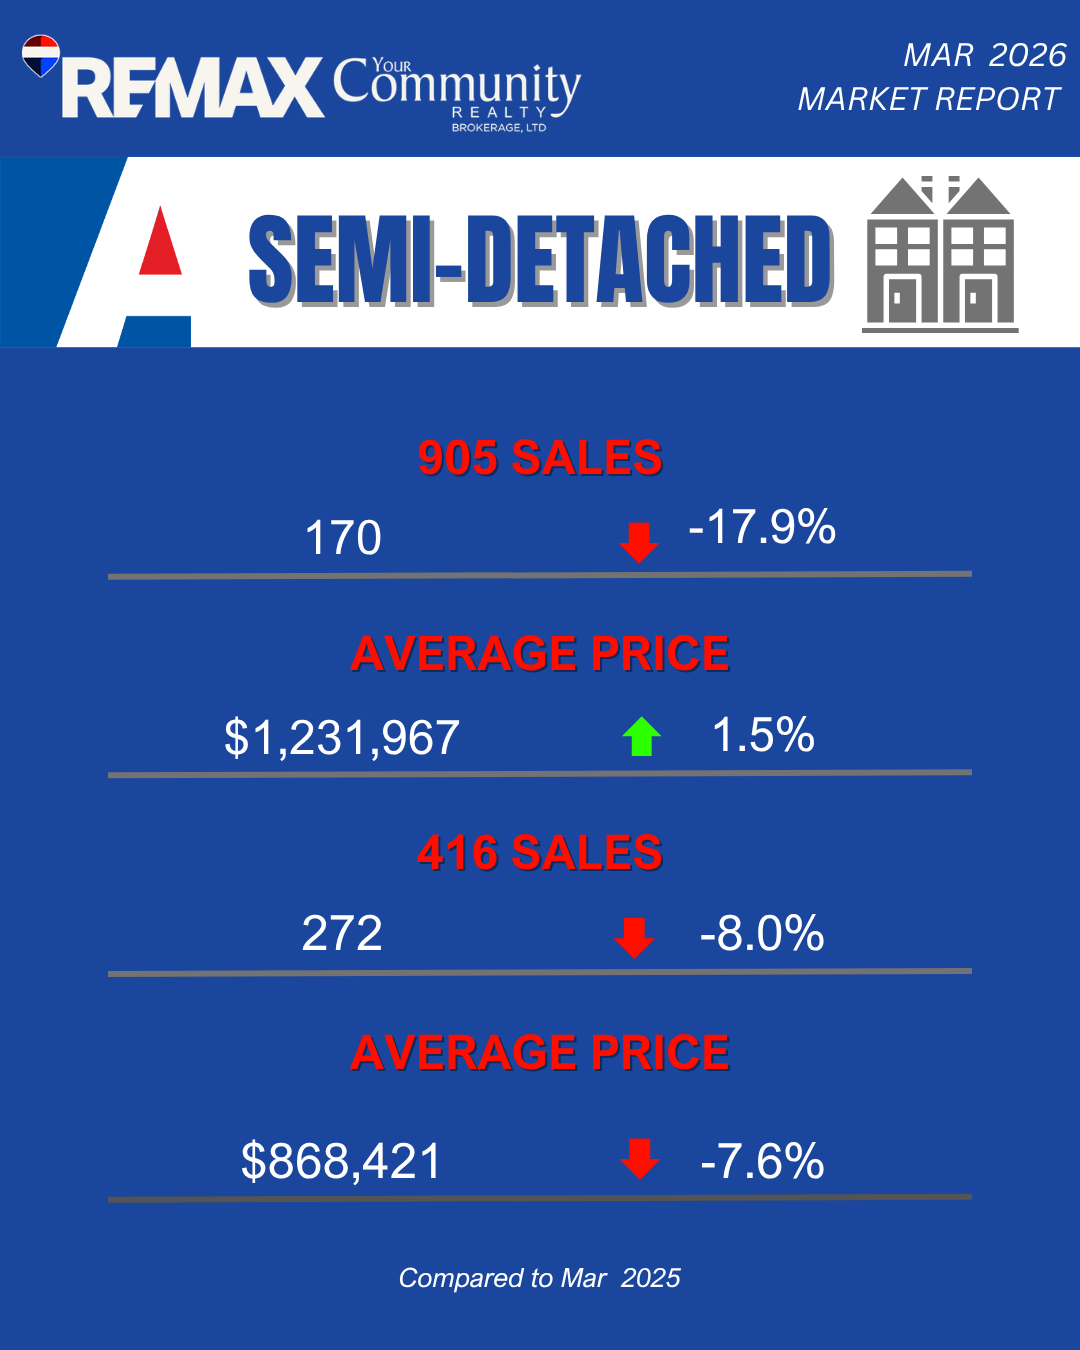
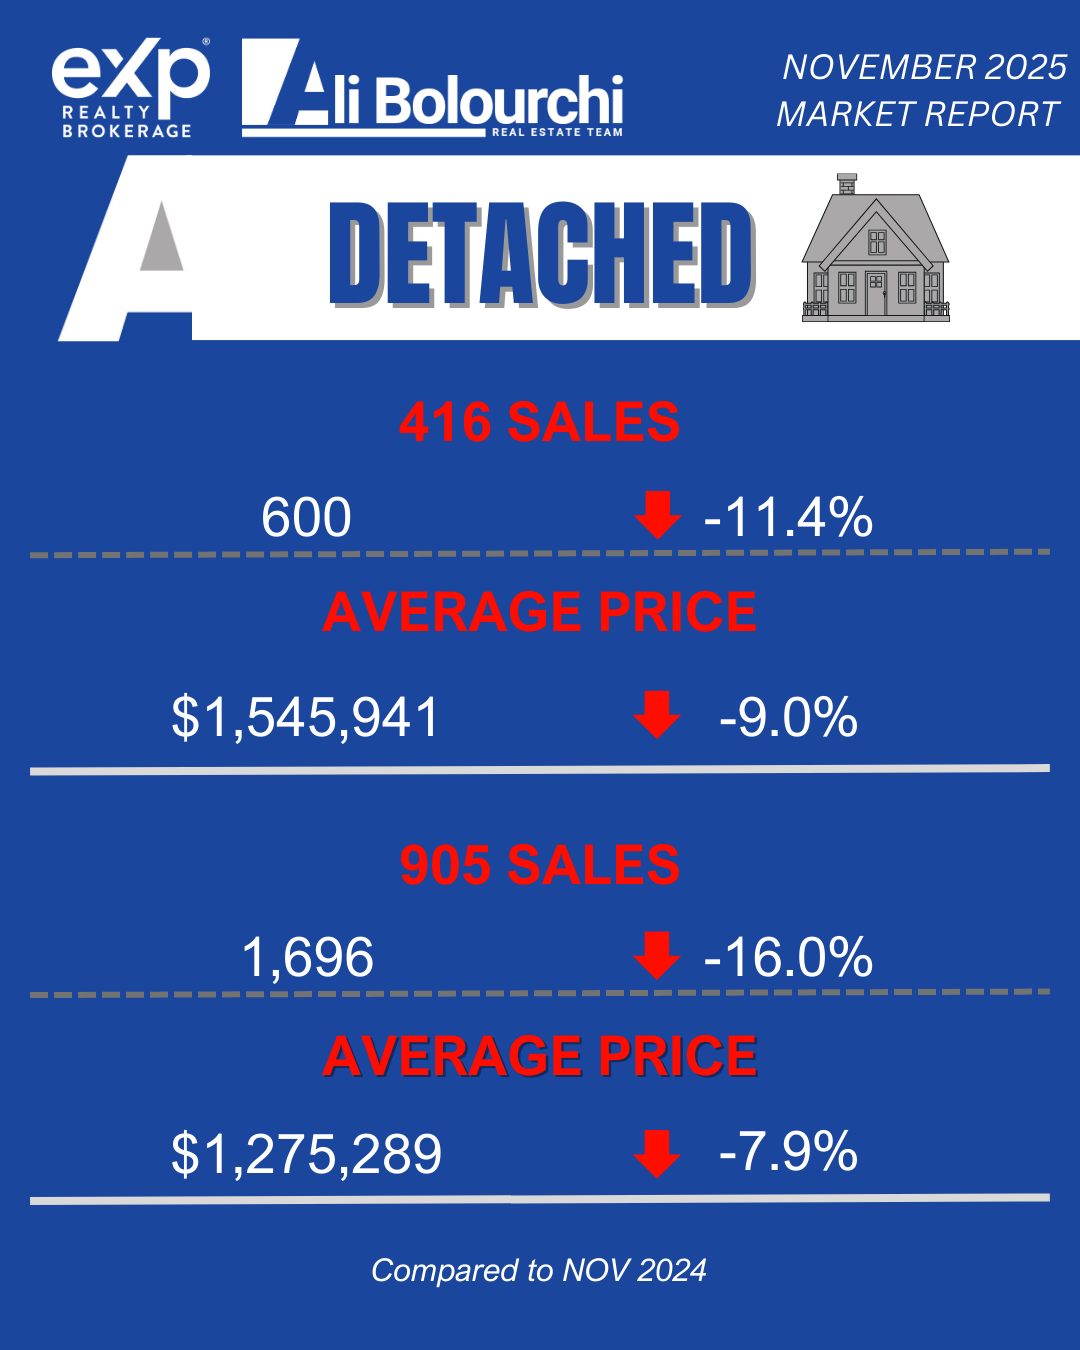
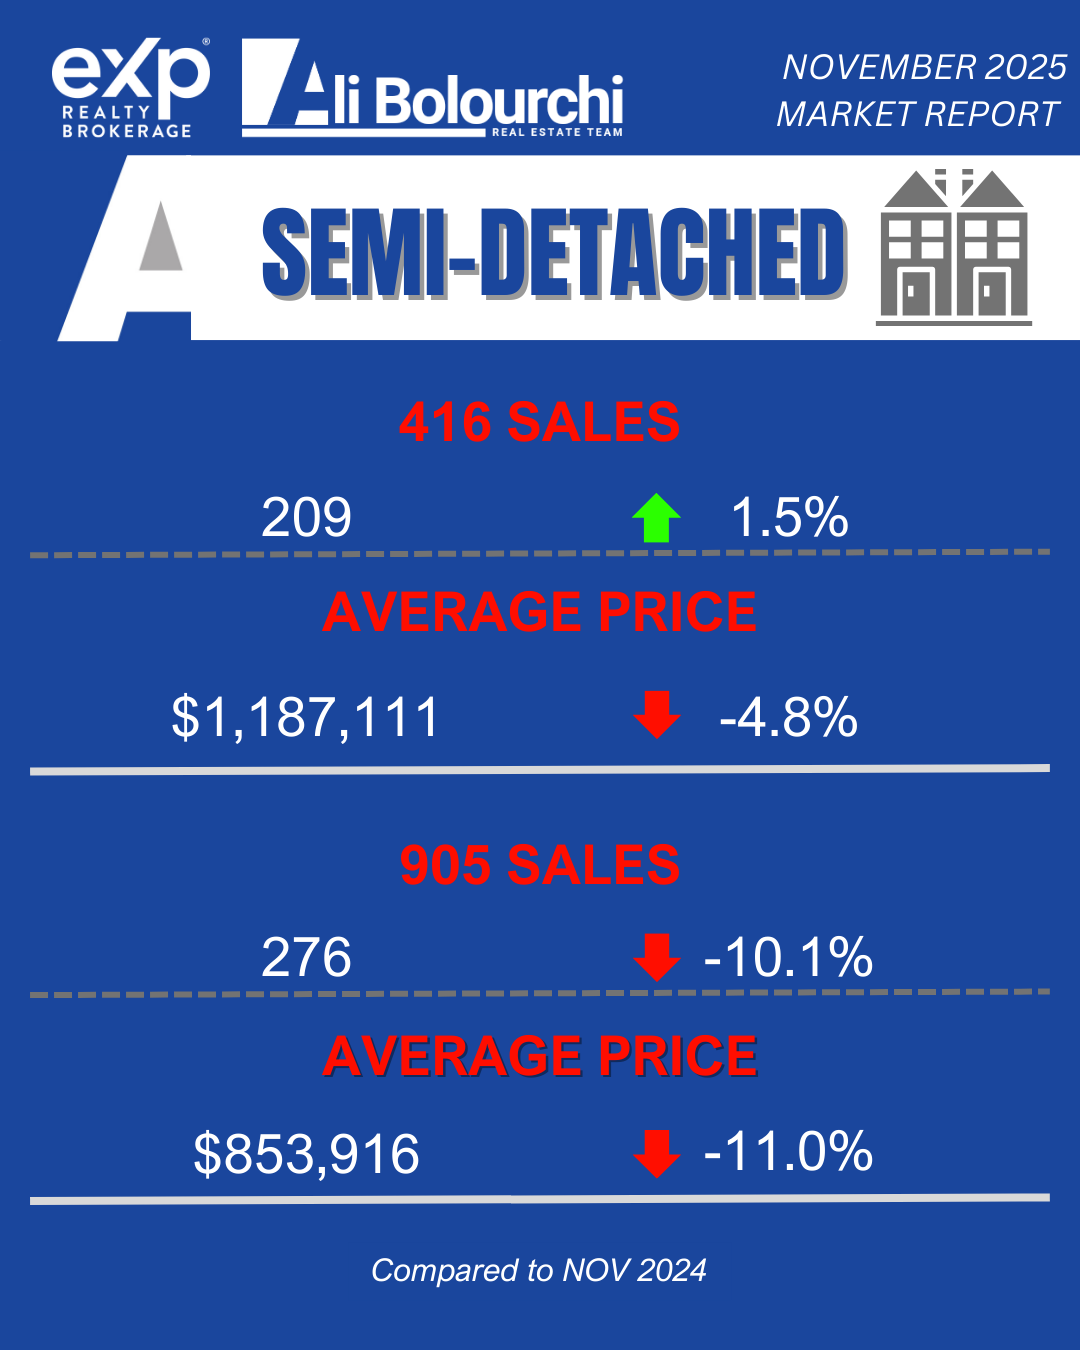
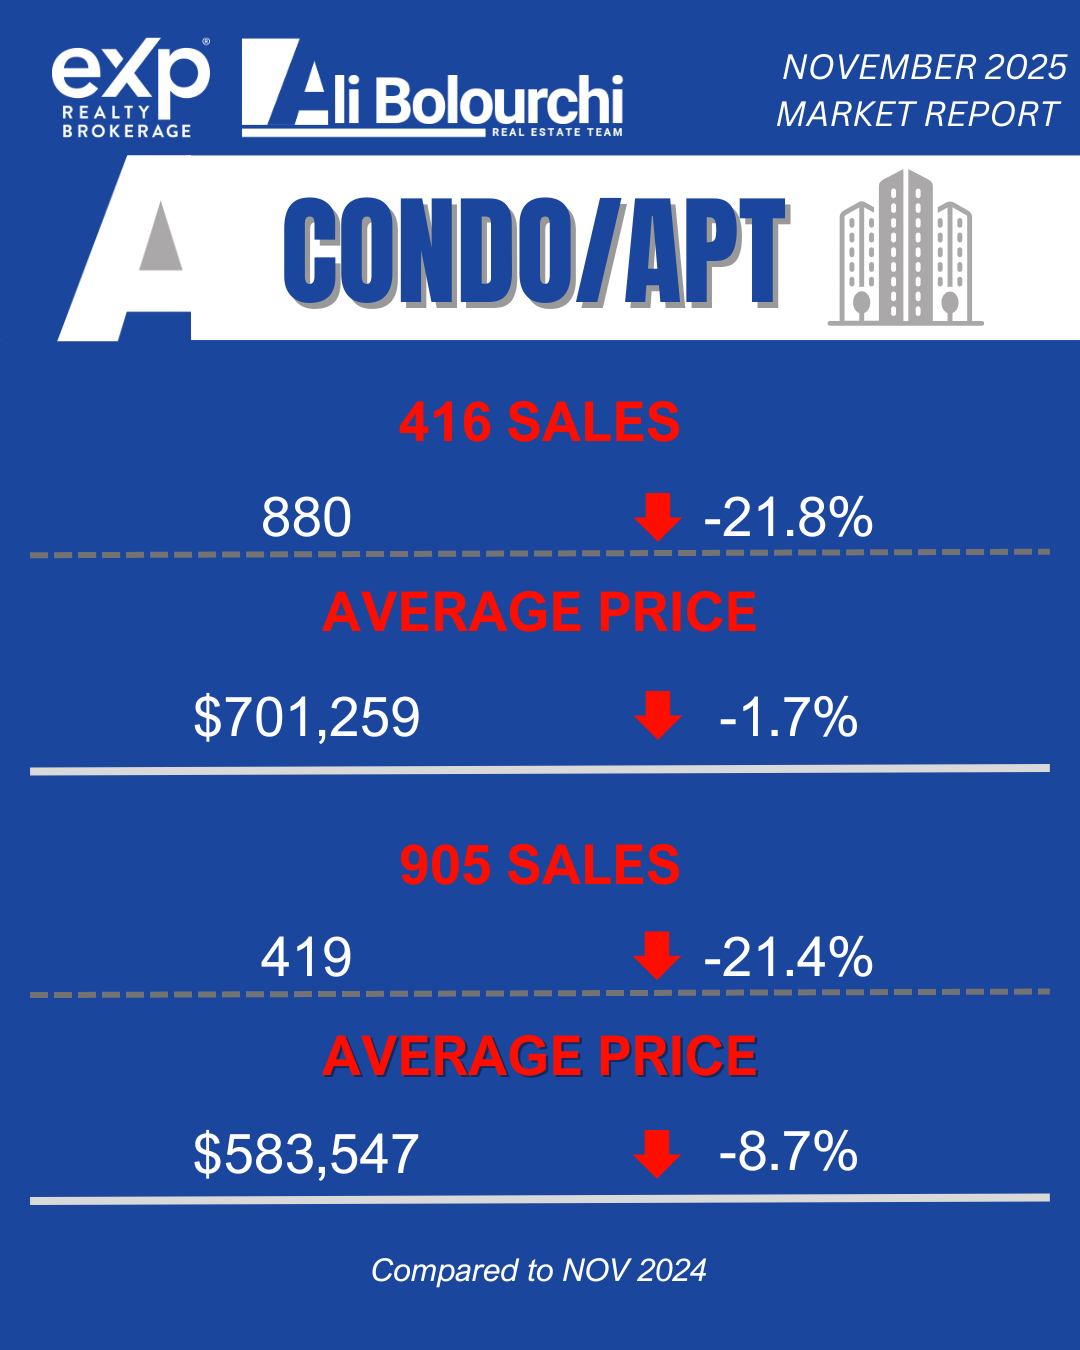
This statistical profile suggests that the market is transitioning from a period of high volatility into a phase of cyclical normalization. The resilience of the semi-detached and detached segments in the 416 area code is particularly noteworthy for strategic investors. These assets serve as the primary inventory for duplex, triplex, and fourplex conversions, maintaining stable demand even as the condominium sector faces a supply overhang and a multi-decade low in pre-construction sales.

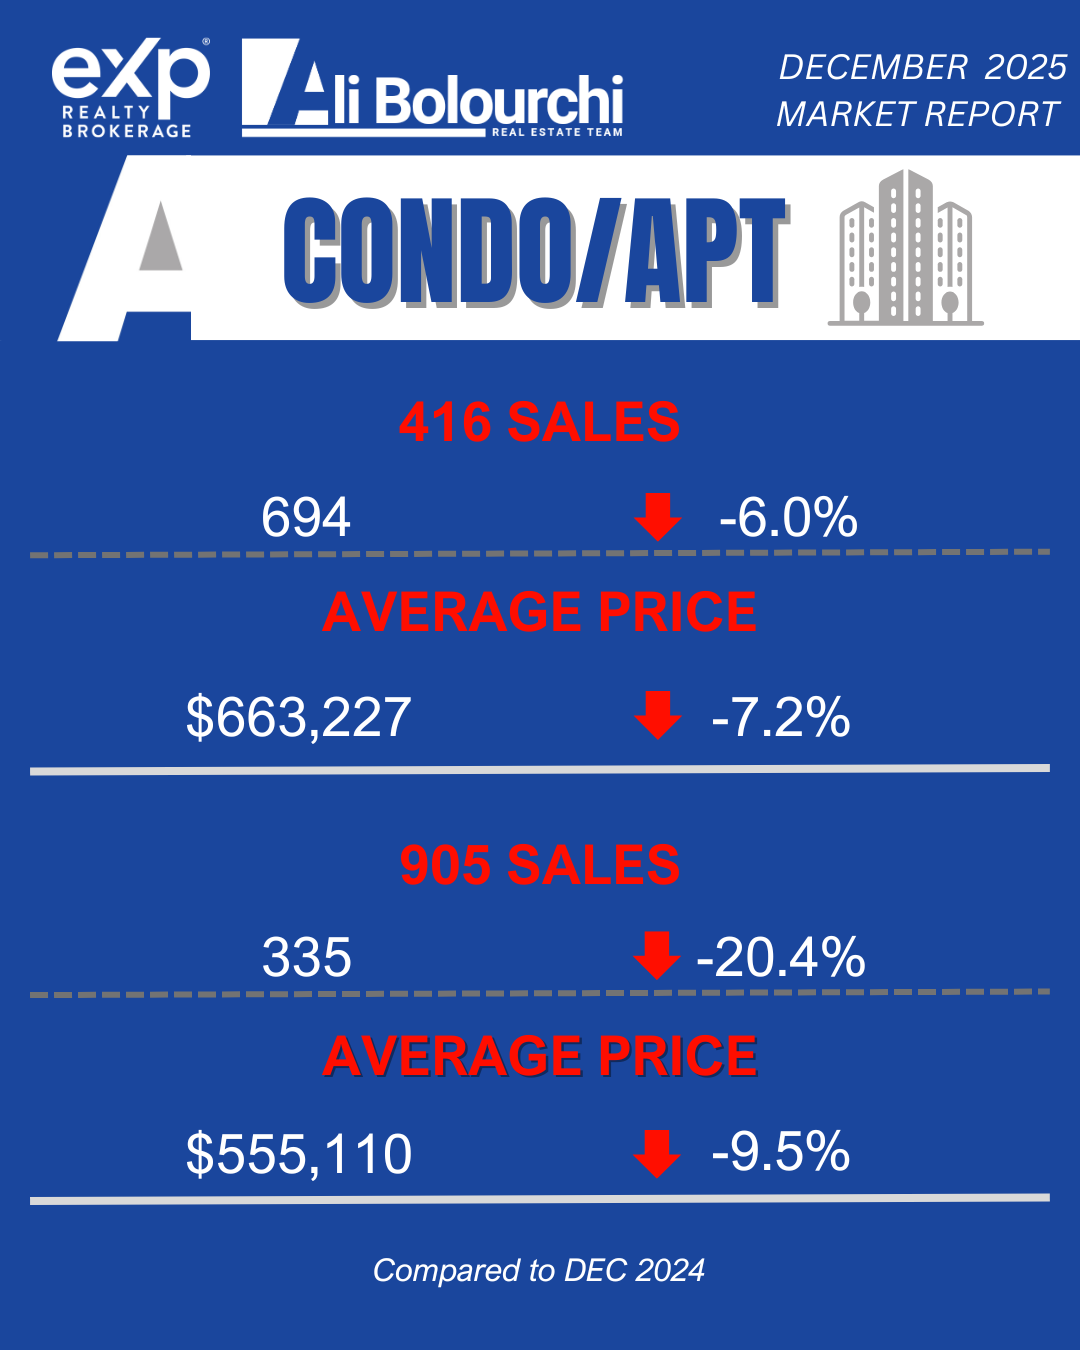
The Realignment of the Condominium Sector

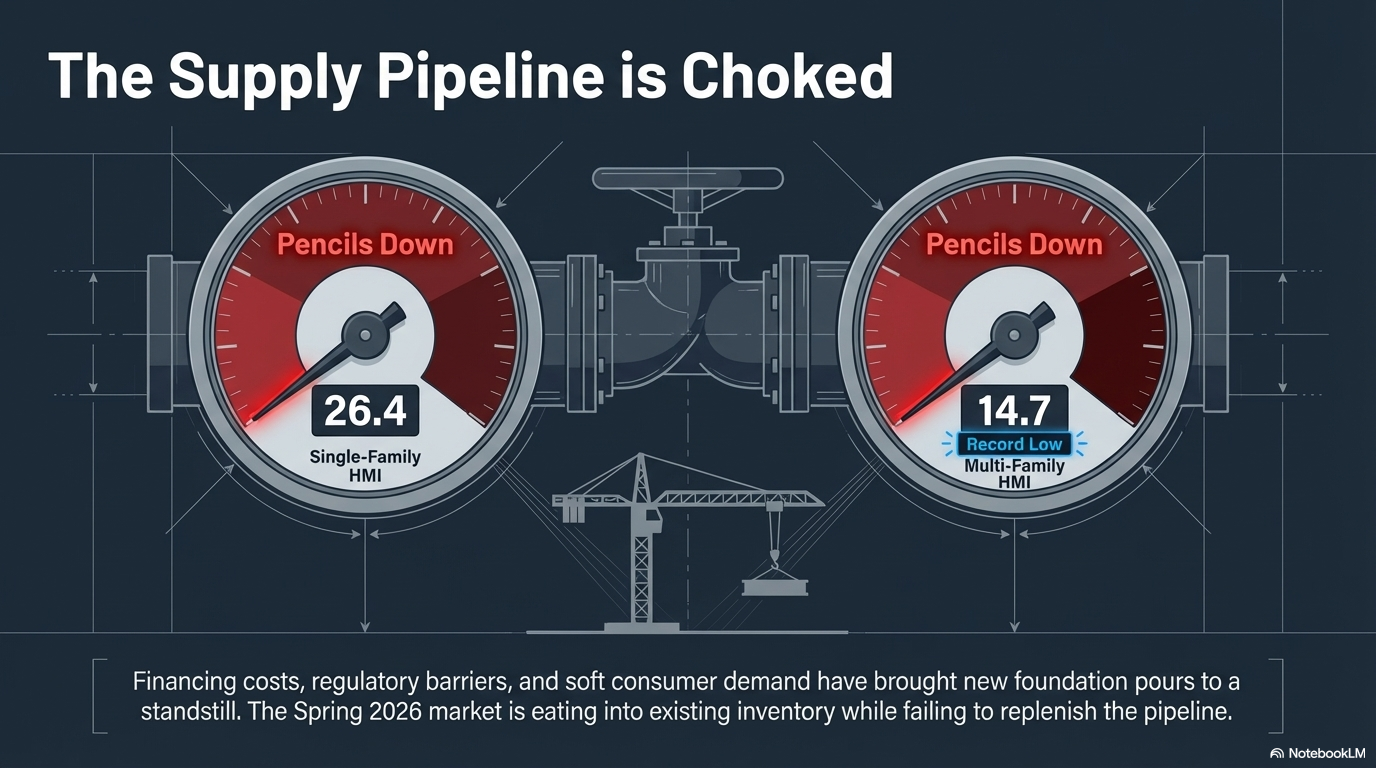
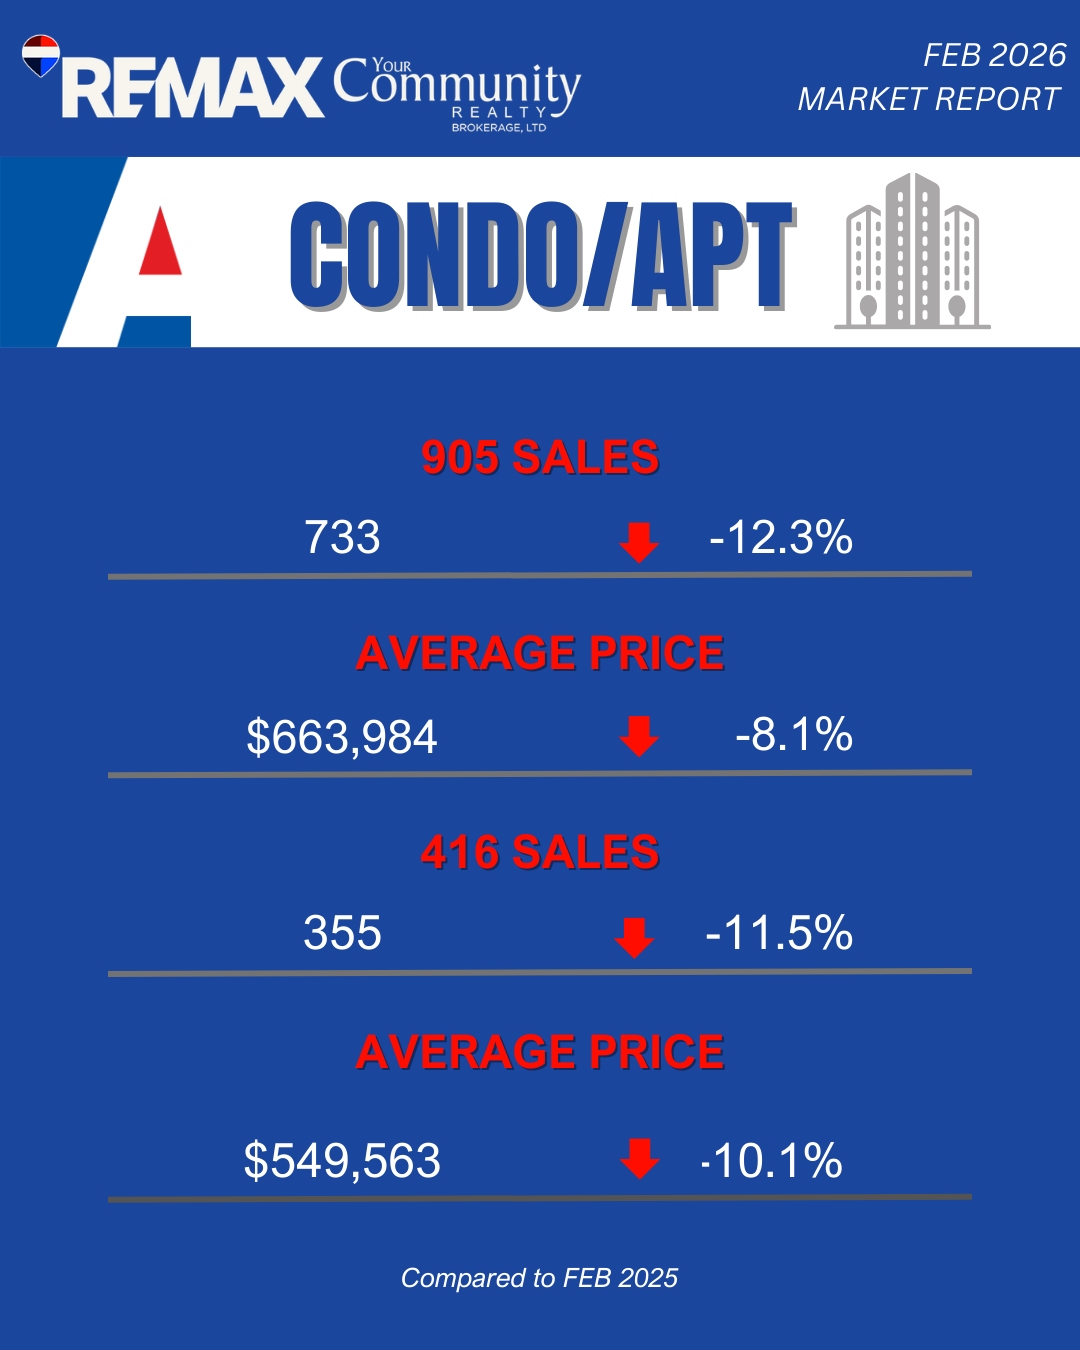
The condominium market in the GTA is currently navigating a period of significant readjustment. High inventory levels, coupled with a surge in secondary rental supply from financially stressed owners, have exerted downward pressure on both sale prices and rental rates. In January 2026, the average price for a condominium in the GTA fell 9.8% year-over-year to $604,759. This softening has led many investors to redirect capital away from single-unit condo investments toward multi-family properties where they exercise greater control over the land and the underlying asset.

The collapse of condominium presales in 2025 has created a vacuum in the future housing pipeline, which is expected to exacerbate supply shortages in the long term. Developers have responded by cancelling high-rise projects or converting them into purpose-built rentals, further emphasizing the shift toward income-producing assets over speculative capital gains.

Missing Middle Construction and Regional Performance Divergence

While high-rise starts have faltered, the construction of missing middle housing—defined as small to mid-scale projects between 4 and 20 units—has shown relative strength. In 2025, missing middle starts rose by approximately 10% across major Canadian metropolitan areas. Toronto has emerged as a leader in this category through conversions, which accounted for more than 21% of all missing middle activity in the city during that period.

Metropolitan Area (CMA)Other Missing Middle Starts (%)Conversions as a Percentage of Total Starts
Vancouver17.92.0
Calgary43.512.3
Edmonton49.76.2
Montréal26.85.3
Ottawa35.79.4
Toronto15.521.2
Halifax14.95.8

The high rate of conversions in Toronto reflects the maturity of its urban fabric and the regulatory push to add density within established neighborhoods. These projects are often delivered faster than high-rise towers and appeal to a demographic that prioritizes living in established communities with high walk scores and proximity to local businesses.

Regulatory Evolution: The Six-Plex Framework and As-of-Right Development

The most significant regulatory catalyst for GTA investors in 2026 is the expansion of as-of-right zoning for multiplexes. Toronto has transitioned from a period of exclusionary zoning, which historically prioritized single-family detached homes, to a more permissive framework that allows for up to six units on most residential lots in designated wards.

Zoning and Density Allowances

As of early 2026, Toronto allows for the conversion of existing detached or semi-detached homes into multiplexes of up to four units as-of-right across the city, with permissions for up to six units in nine pilot wards. These pilot areas include the former City of Toronto, East York, and parts of Scarborough North. The regulations permit buildings up to four storeys high with a maximum height of 10.5 meters, facilitating taller basement ceilings and improved natural light for lower-level units.

The framework also permits the addition of accessory dwelling units (ADUs), such as laneway or garden suites. In many cases, an investor can achieve seven units on a single lot by combining a six-unit main building with one garden suite. To qualify as a multiplex, at least one unit must be located entirely or partially above another unit; otherwise, the structure is classified as semi-detached or townhouse housing.

Financial Incentives for Residential Densification

To stimulate the development of these units, the City of Toronto has implemented a waiver of development charges (DCs) for the first six residential units on a property. This represents a substantial reduction in upfront costs, as development charges in the GTA can exceed $120,000 for low-rise units. Furthermore, the city has waived parking minimums for small multiplexes, removing the requirement to provide on-site vehicle parking and allowing for more efficient use of the lot for housing.

The economic feasibility of these projects is further enhanced by the Ontario government's policy of waiving development charges for additional units in existing buildings, provided they do not exceed 1% of the existing unit count or one unit, whichever is greater. These combined municipal and provincial measures have made the conversion of underutilized low-rise housing one of the most financially attractive strategies in the 2026 market.

Financial Engineering: Mastery of the CMHC MLI Select Program

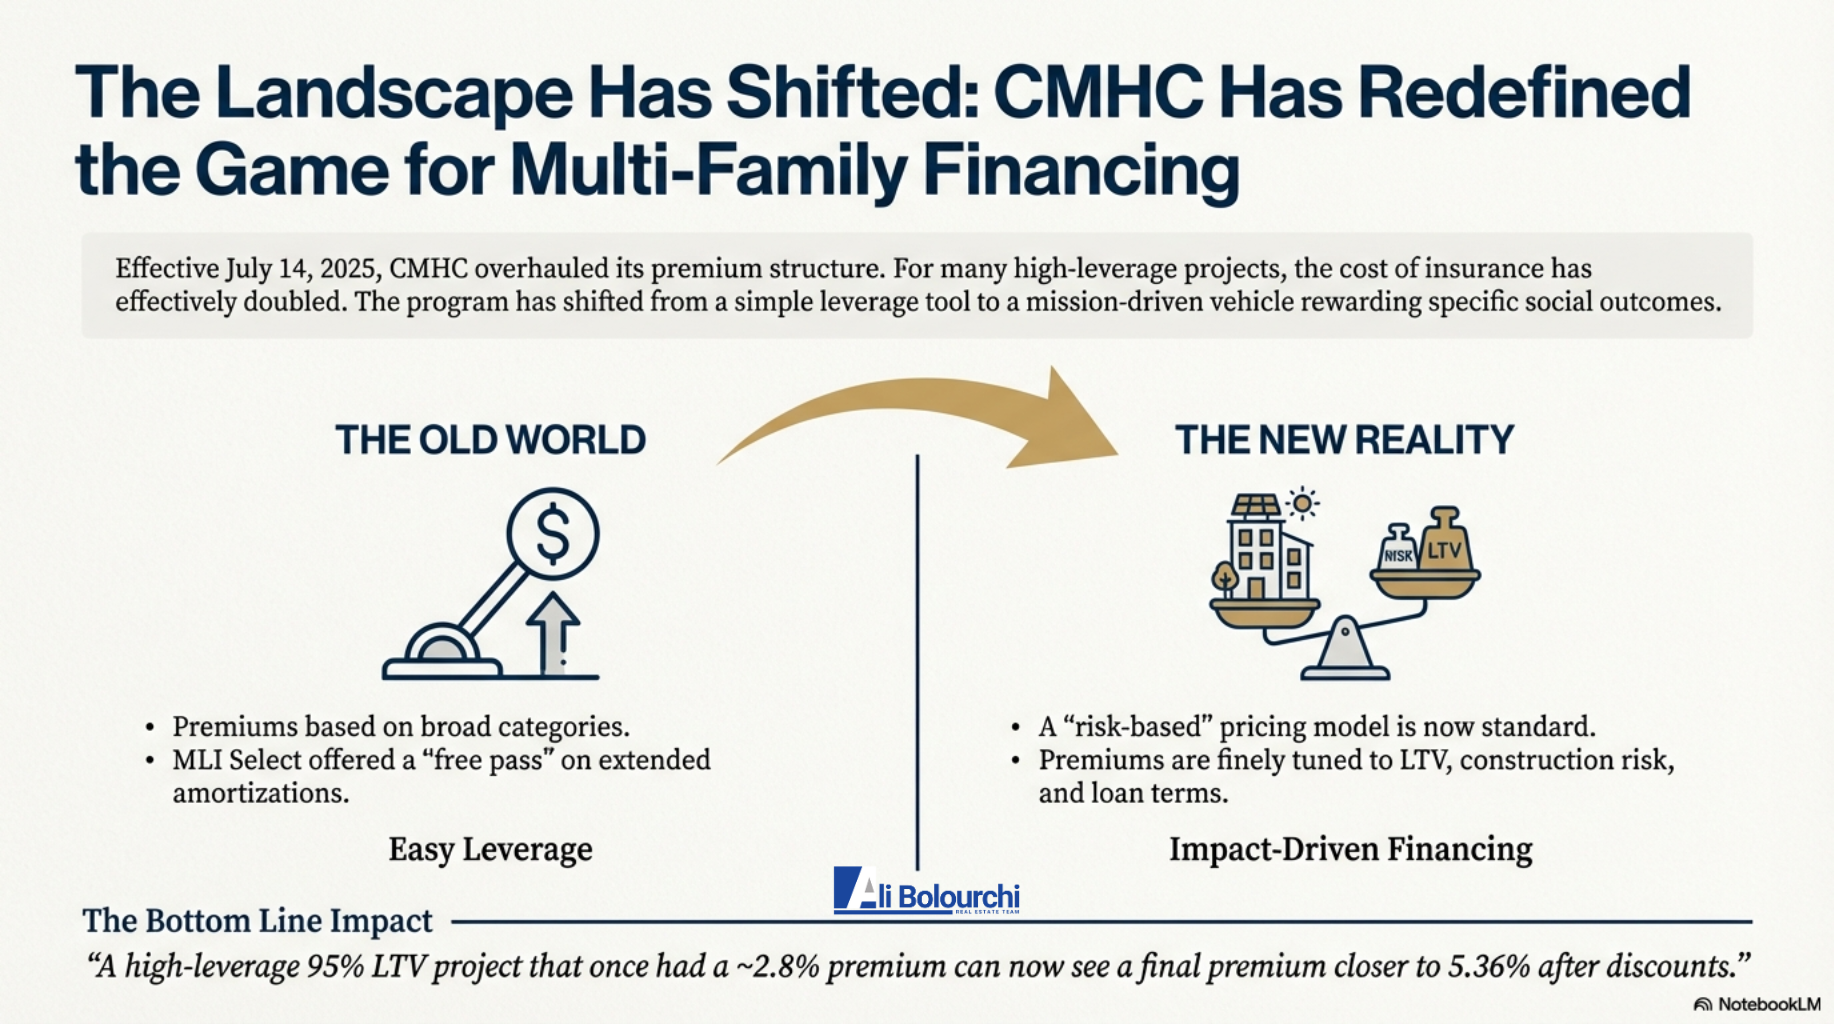
The pivot toward multi-unit investing is inextricably linked to the Canada Mortgage and Housing Corporation (CMHC) MLI Select program. This insurance product has been redesigned in 2025 and 2026 to incentivize the creation of affordable, energy-efficient, and accessible rental housing.

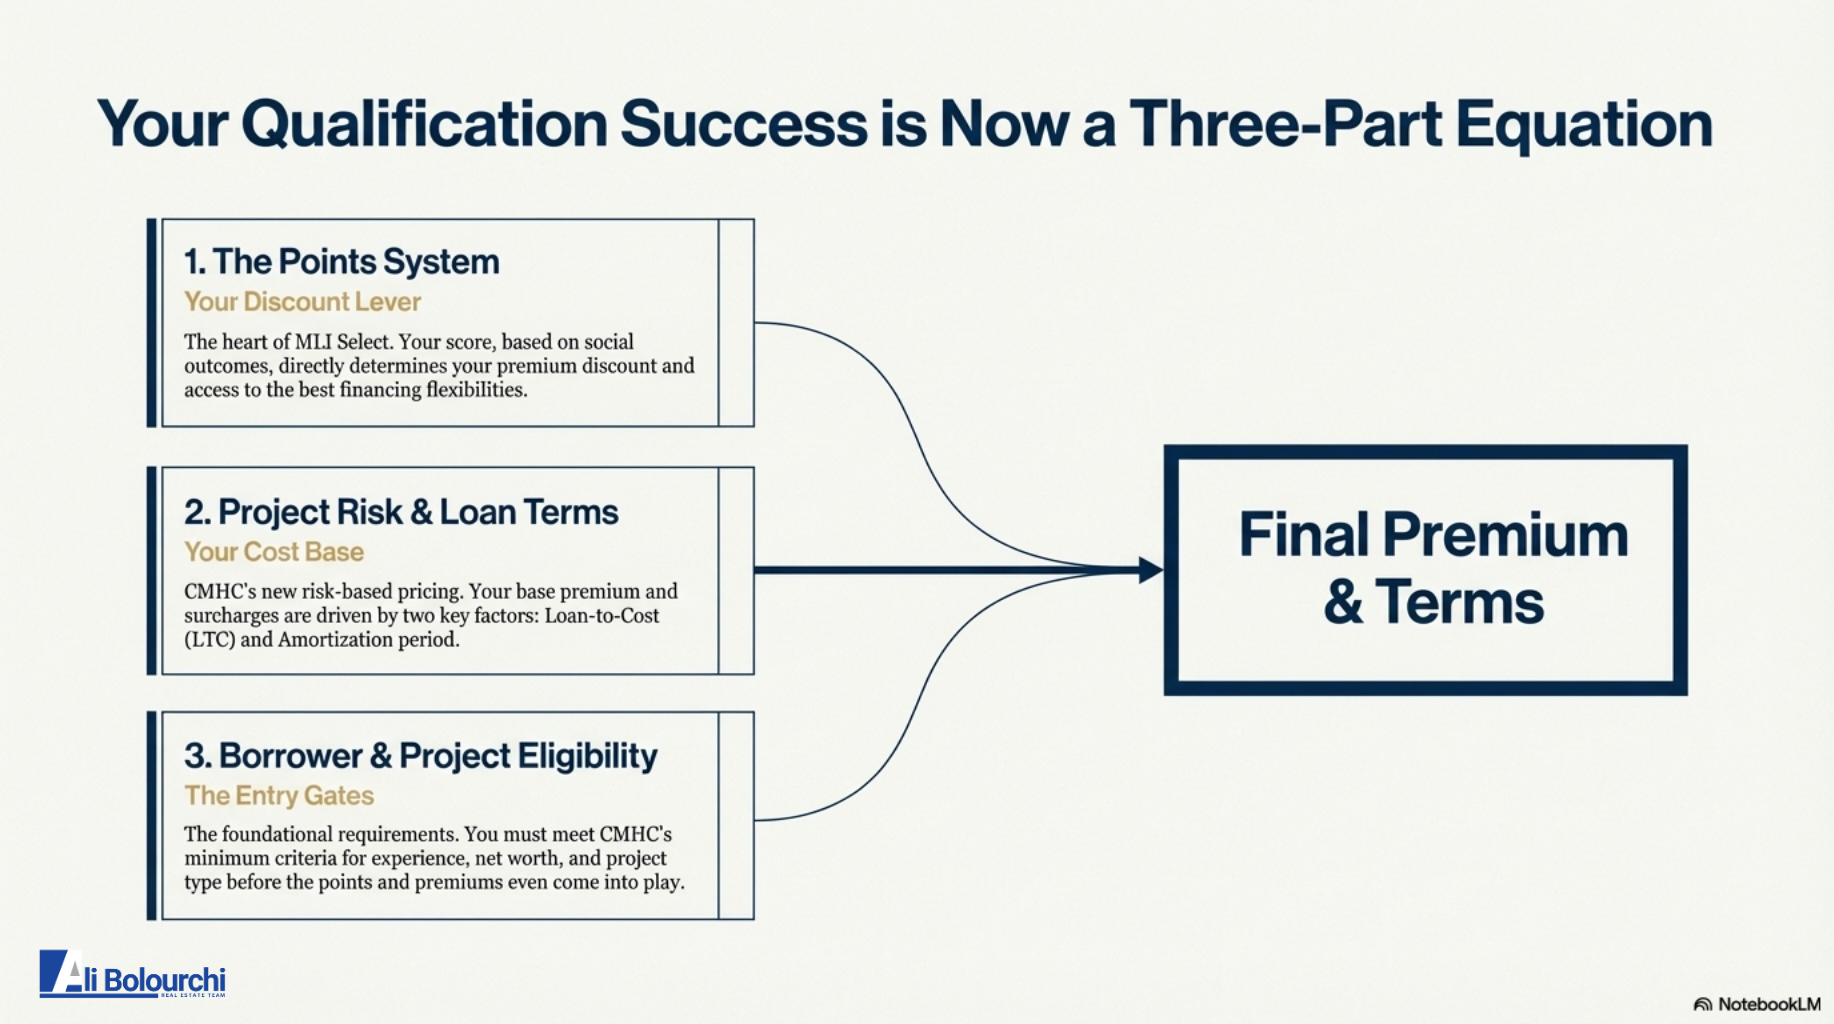
The Points-Based Incentive System

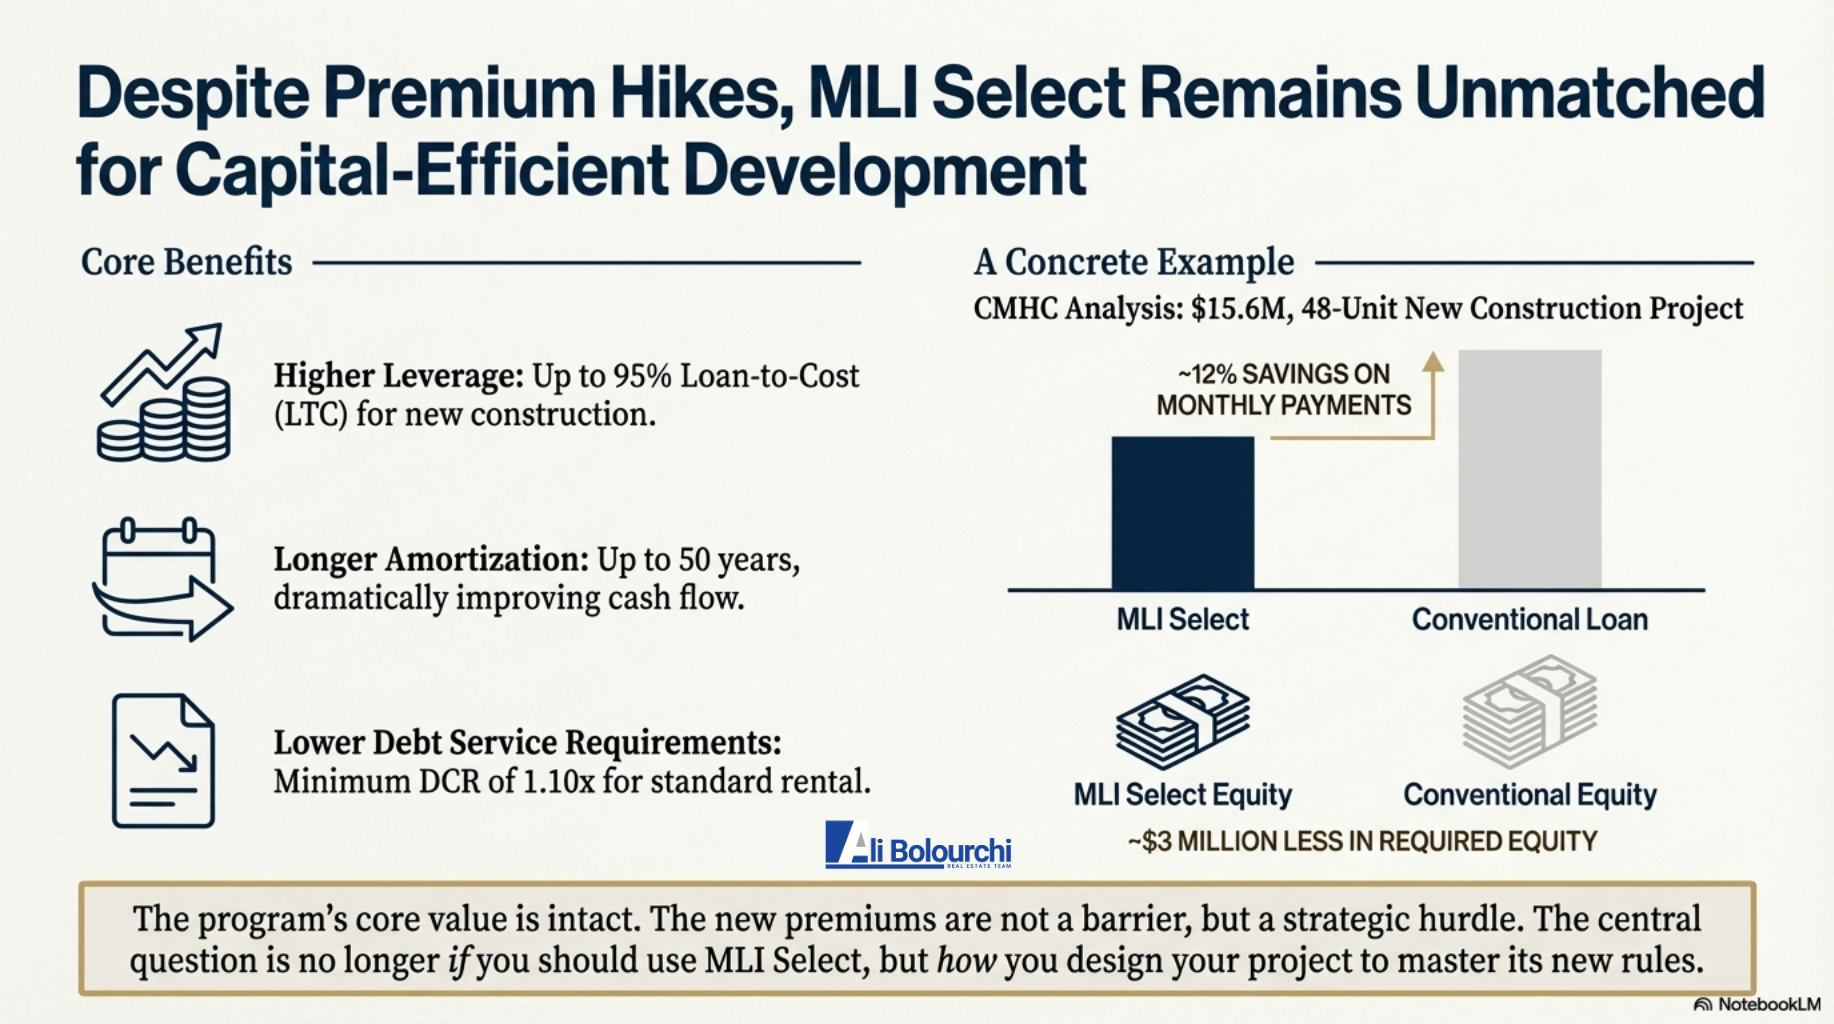
MLI Select utilizes a points-based system to determine eligibility for enhanced financing terms. A project must achieve a minimum of 50 points to qualify, with maximum benefits realized at 100 points or more.

Financing Feature50 Points Tier70 Points Tier100+ Points Tier
Maximum Loan-to-Value (LTV)Up to 95%Up to 95%Up to 95%
Maximum Amortization40 Years45 Years50 Years
Premium Discount10% Discount20% Discount25-30% Discount
Recourse StructureFull RecourseLimited RecourseLimited Recourse

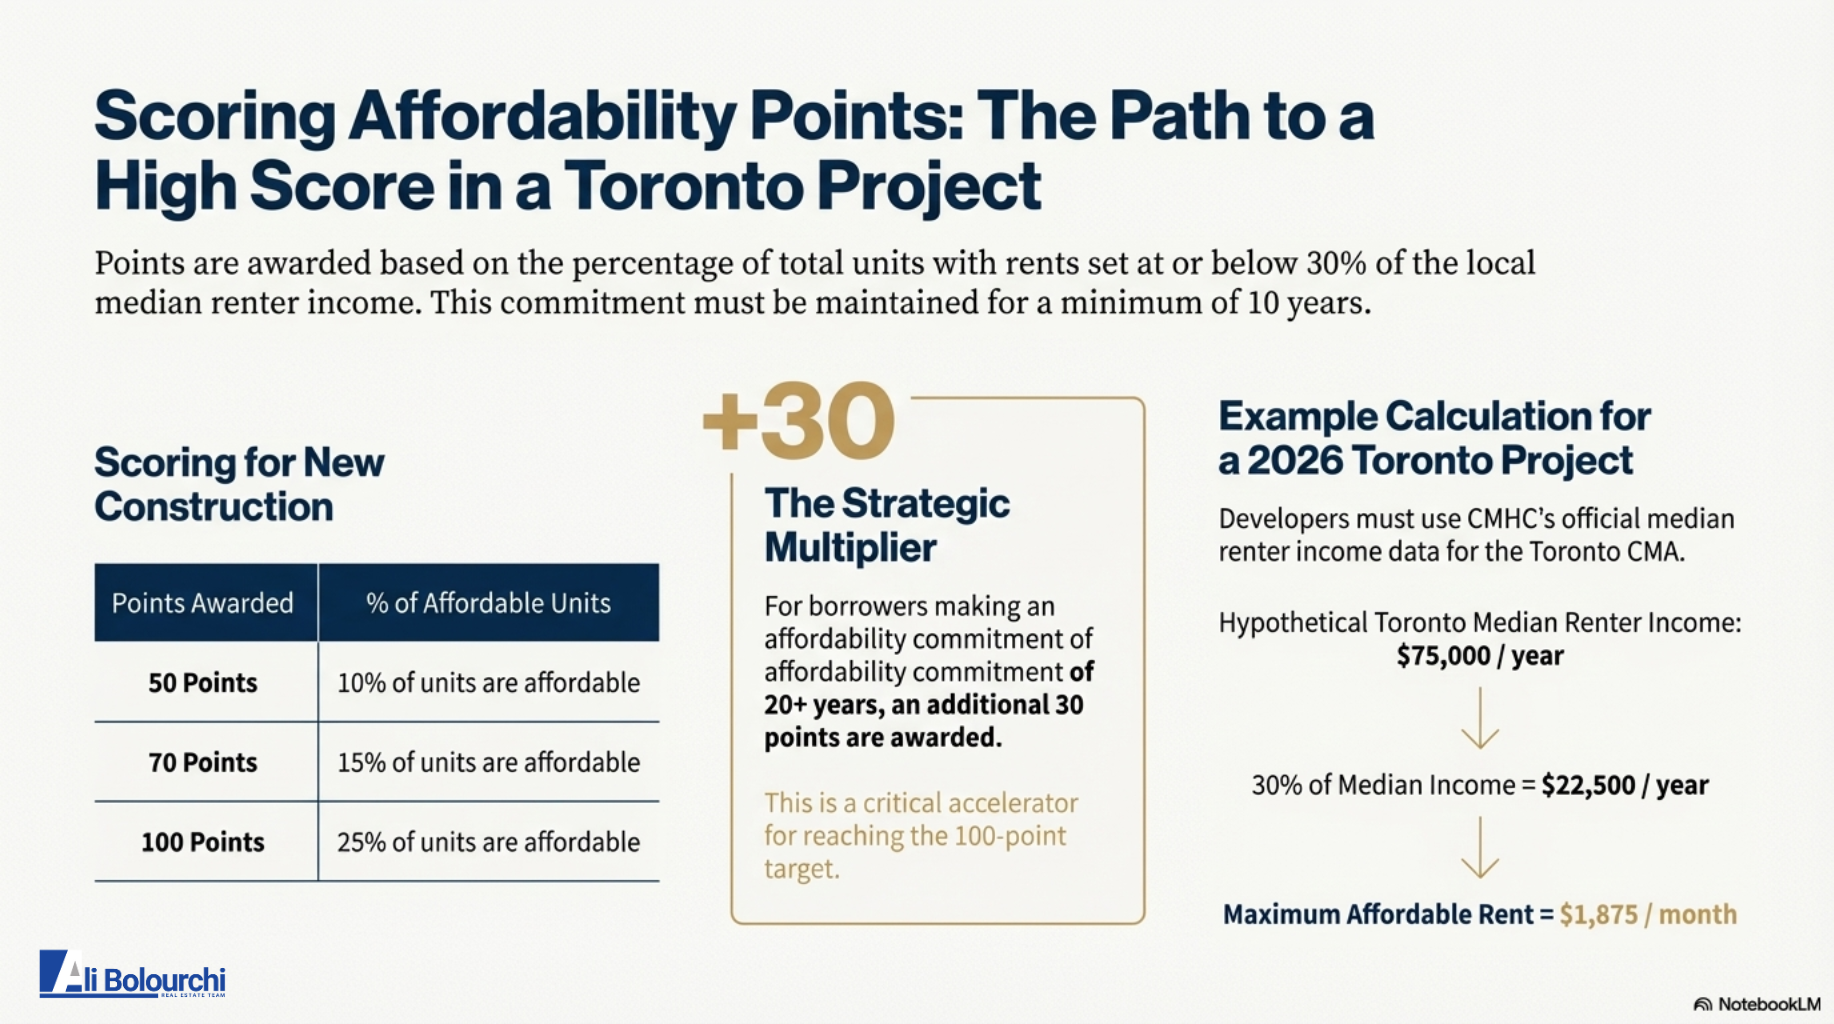
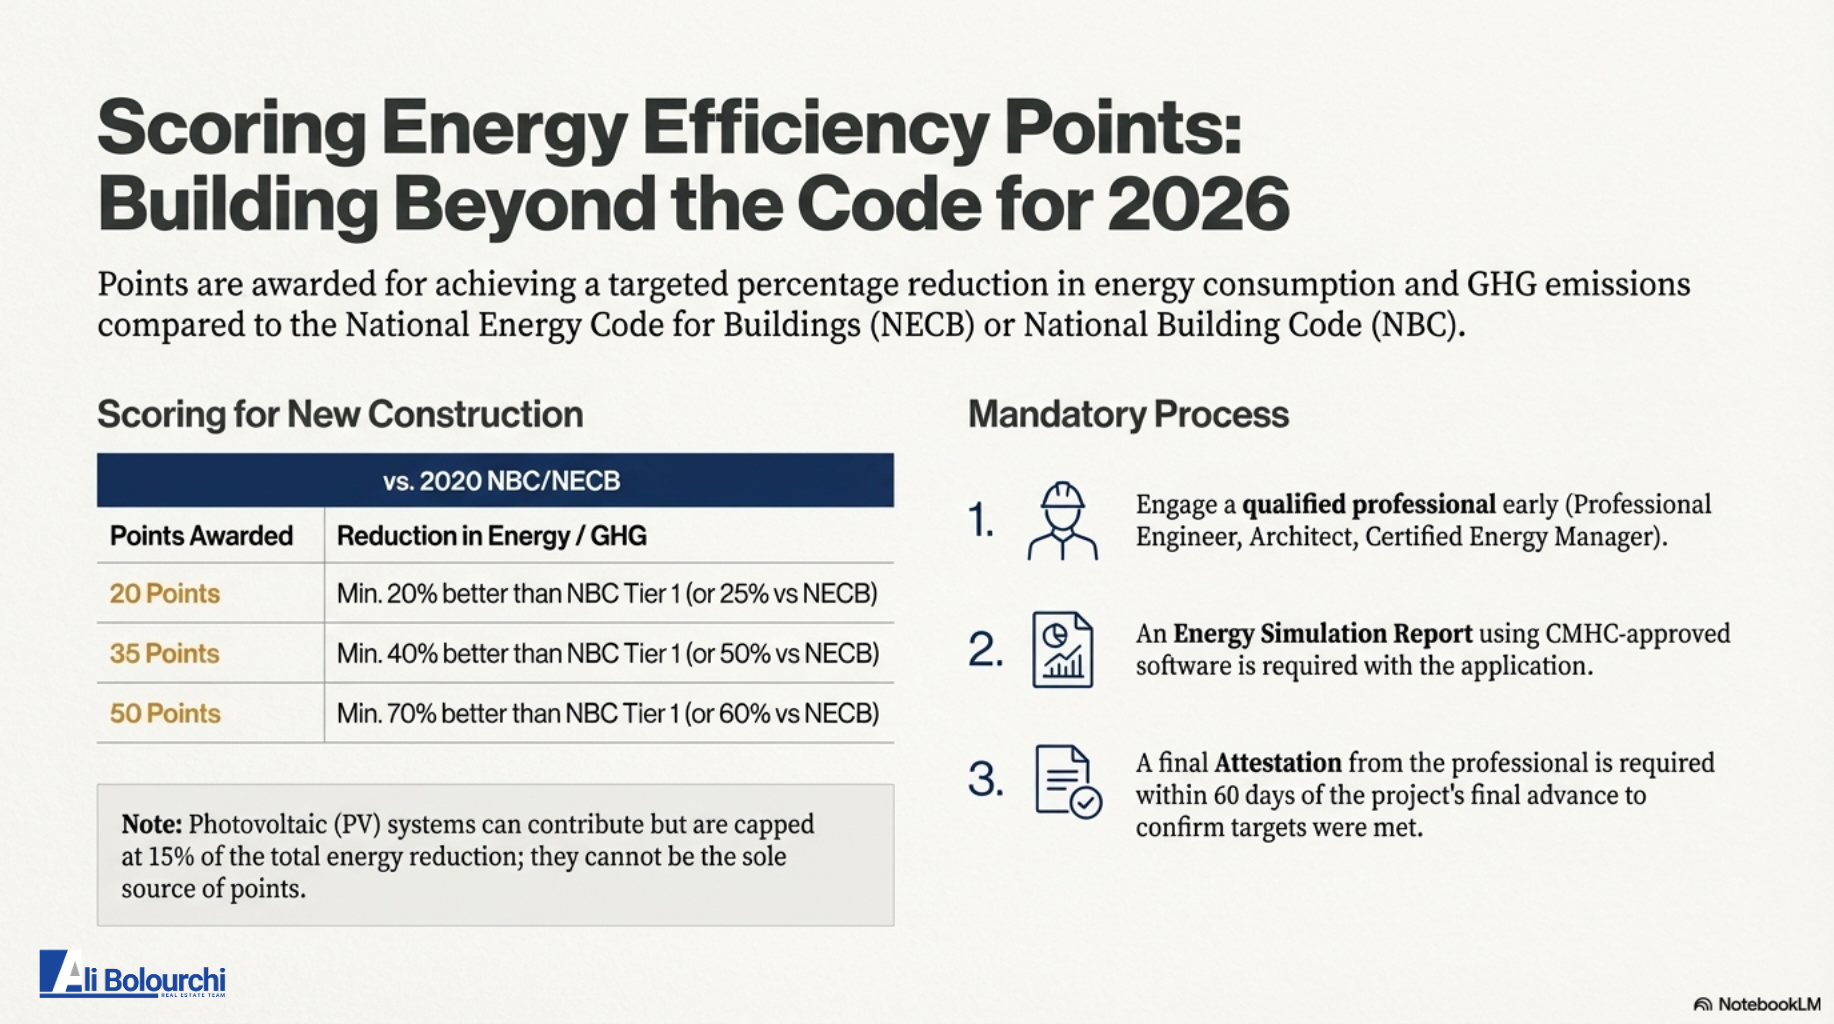
The scoring criteria are divided into three social outcome categories: affordability, energy efficiency, and accessibility. For example, a project can earn 50 points by committing that 10% of its units will be rented at 30% of the median renter income for the region for a minimum of 10 years. Energy efficiency points are awarded for achieving a 20% to 40% reduction in energy consumption relative to the National Energy Code for Buildings (NECB).

Strategic Implications of 50-Year Amortization and Cash Flow

The ability to access 50-year amortizations through MLI Select is a transformative tool for cash-flow optimization. By extending the repayment period, investors can significantly reduce monthly debt service obligations, thereby increasing the property's net operating income (NOI) and overall return on investment.

For instance, on a $5 million project, the difference between a conventional 30-year amortization and a 50-year insured amortization can amount to thousands of dollars in monthly cash flow savings. This leverage allows investors to scale their portfolios more rapidly by reinvesting the surplus cash flow into additional acquisitions.

Mandatory Surety Bonding and Capital Requirements in 2026

A critical update to the MLI Select program in 2025 and 2026 is the non-negotiable requirement for surety bonding on all construction projects. This applies even to owner-operators and small-scale developers who act as their own general contractors. The bonding must typically include a performance bond covering 50% of the contract value and a labor and material payment bond covering another 50%. These requirements ensure that the project will be completed and that subcontractors will be paid, reducing the risk for both the lender and CMHC.

Investors must also be prepared for significant upfront capital requirements. While MLI Select offers up to 95% financing, construction draws are typically paid out in stages. In many cases, an investor must cover approximately one-third of the total project costs in cash before the first draw is released. This necessitates a robust balance sheet and often requires the use of bridge or private financing during the initial construction phase.

The Strategic Real Estate Advisor Persona: Precision and Calculated Confidence

In the 2026 market, the role of the real estate professional has evolved from a transactional agent to a high-level strategic advisor. This model, exemplified by the ABRE Team, emphasizes the use of data-driven industrial engineering principles to optimize financial outcomes for clients.

Industrial Engineering and Market Foresight

The integration of industrial engineering methodologies allows for the precise analysis of the "time value of money" and "process optimization" in real estate transactions. This approach is designed to eliminate the guesswork and emotional paralysis that often hinder investors in complex markets like the GTA. By utilizing an 8-Point Segmented Market Analysis, a strategic advisor can provide precision data specific to a client's street or asset class, rather than relying on broad, often contradictory city-wide statistics.

Empathy-Driven Copywriting and Intent-First Communication

Modern real estate advisory also requires a sophisticated approach to communication. This involves shifting away from traditional sales scripts toward "calculated confidence" and "empathy-driven" messaging. The objective is to speak directly to the target audience's needs and fears—such as the fear of financial regret or the vulnerability caused by market opacity.

Content strategy must align with search intent, focusing on narrow, "winnable" topics that attract qualified prospects. A 9-step SEO system can be utilized to ensure that social posts and blog content are scannable, value-rich, and optimized for both humans and search engines.

Identifying Investor Psychology in the 2026 GTA Market

The contemporary investor profile in the GTA has shifted significantly in response to the volatility of the early 2020s. The ideal customer is now identified as the "Ambitious Mainstream Strategist"—financially stable, budget-conscious individuals between the ages of 28 and 55 who view real estate as their primary vehicle for long-term wealth building.

Core Problems and Internal Motivations

The primary external problem facing these investors is market opacity. They are inundated with contradictory statistics and lack the precise, segmented data needed to take decisive action. Internally, they are driven by a profound fear of financial regret—specifically the fear of buying at the peak of a cycle, selling at a low, or acquiring a flawed asset.

Philosophically, these individuals believe that hard-working people deserve a clear, strategic path to build wealth, but they feel the current market is often "rigged for insiders". They are frustrated by the time wasted on ambiguous news that is not specific to their localized street or asset class.

The Demand for Guidance over Sales

Investors in 2026 no longer respond to the pushy, high-pressure salesperson. While some may mistake aggression for effectiveness, the most successful advisors counter this by delivering "Calculated Confidence" through data. The repetitive question in the market is no longer "How high can this go?" but rather "Is now really the right time to act, or should I wait for the next rate cut?".

The ABRE Team approach addresses this by moving from selling to guiding. This involves simplifying complex processes and data, ensuring that every strategic recommendation is backed by objective economic analysis rather than personal commission-driven urgency.

The Project Lifecycle of a Toronto Multiplex Conversion

To successfully execute the strategies discussed in these blogs, investors must understand the operational realities of the 2026 conversion market. The process is governed by a combination of the Ontario Building Code, municipal by-laws, and federal insurance requirements.

Budgeting and Timelines for Multiplex Development

Successful projects require a rigorous approach to project management. Construction costs, while off their pandemic peaks, remain elevated, requiring precise budgeting for materials and labor.

Project StageEstimated TimeframeCost/Requirement
Zoning Review Application1 Month+$600 - $2,000
Design & Detailed Drawings2 - 4 Months$10,000 - $30,000
Committee of Adjustments3 - 6 Months$5,000+ (If Required)
Building Permits and Fees1 - 2 Months$10,000 - $20,000+
Multiplex Conversion Work3 - 12 Months$40,000+ per unit
New Multiplex Build12 - 24 Months$250 - $400 / sq. ft.
Surety BondingPre-Construction10% of Hard Costs

Technical Compliance: Part 9 of the Building Code

One of the natural advantages of missing middle projects is their ability to utilize "Part 9" construction standards. This streamlined section of the Building Code applies to housing and small buildings, allowing developers to undercut the complex and expensive cost structures required for high-rise towers. To qualify as a multiplex under these rules, each unit must have a private entrance, a kitchen, and a bathroom.

Effective February 16, 2026, all building permit applications in Toronto must utilize an updated "Application for a Permit to Construct or Demolish" form. Drawings must be submitted on standardized sheets, fully dimensioned, and often require the seal of a professional engineer. For renovations of residential units, a "Rental Renovations License" may also be required under Toronto Municipal Code Chapter 662 to protect tenant rights during the conversion process.

Performance Metrics: The Cap Rate Formula

In the multiplex sector, property value is driven primarily by income potential rather than simple comparable sales. Investors utilize the capitalization rate (cap rate) to assess the feasibility of a deal.

In the 2026 Toronto market, smaller multiplex properties typically trade at cap rates between 5.0% and 5.5%. For a turnkey triplex generating $6,000 per month in rent, the resulting income returns are often comparable to much larger, more complex projects but with significantly lower execution risk.

Conclusion: Synthesis of the 2026 Investment Outlook

The research indicates that the Greater Toronto Area real estate market in 2026 is defined by a shift toward resilient, income-producing assets. The return of the missing middle is not merely a trend but a structural response to the failure of the high-rise condominium model to meet the needs of families and long-term investors.

The successful investor in this era is one who moves from guesswork to "Calculated Confidence" by leveraging industrial engineering principles and precision market data. By mastering the CMHC MLI Select program—including its complex points system and mandatory bonding requirements—investors can access unprecedented leverage, such as 95% LTV and 50-year amortizations, to scale their portfolios.

The suggested blog titles provide a roadmap for communicating these high-level strategic insights to a market that is increasingly skeptical of traditional sales tactics. By focusing on intent-first, data-driven content, real estate professionals can position themselves as the necessary guides for the "Ambitious Mainstream Strategist," transforming underutilized residential lots into multi-generational "equity machines".

Read

Market Watch February 2026: Sellers Hold Back as the GTA Market Tightens

The Greater Toronto Area (GTA) real estate market is sending mixed signals this February, but the biggest story isn't about buyers—it’s about sellers.

According to the latest TRREB data, new listings plunged by an enormous 17.7% year-over-year. With only 10,705 new properties hitting the market, supply is tightening. While sales also dipped slightly to 3,868 transactions (down 6.3% from last year), the lack of fresh inventory is keeping the market highly competitive in certain pockets.

The average selling price across the GTA has climbed back over the $1 million mark to $1,008,968. Though this is still down 7.1% compared to February 2025, we are seeing incredible resilience in low-rise city homes, while the condo sector continues to offer deep discounts. TRREB notes there are over 100,000 buyers sitting on the sidelines waiting for the right moment.

Here is your deep dive into how the 416 (City of Toronto) and 905 (Suburban GTA) markets performed by property type in February 2026.


🏡 Detached Homes

Detached homes still make up the lion's share of sales (over 43% of all transactions), but they are seeing some of the sharpest price drops, creating a rare window for move-up buyers.

  • 416 (Toronto Core)

    • Average Price: $1,568,543.

    • Trend: Prices took a noticeable hit, dropping 11.4% year-over-year. Interestingly, sales volume actually increased by 3.6%, proving that when city detached homes are priced to reflect the current market, buyers are eagerly scooping them up.

  • 905 (GTA Suburbs)

    • Average Price: $1,240,467.

    • Trend: Down 7.5% year-over-year.

Insight: If you own a smaller property and have been dreaming of a detached home in the city, the gap has narrowed significantly. The 11.4% discount in the 416 is a massive opportunity that likely won't last once those 100,000 sidelined buyers jump back in.


🏘️ Semi-Detached Homes

Semi-detached homes are the undisputed stars of the February market. As the ultimate "missing middle" property, they offer freehold living at a more accessible price point than detached homes.

  • 416 (Toronto Core)

    • Average Price: $1,229,853.

    • Trend: Down 4.6% year-over-year. Demand here is red-hot; the sales-to-new-listings ratio (SNLR) for 416 semis is sitting at a highly competitive 55%.

  • 905 (GTA Suburbs)

    • Average Price: $864,088.

    • Trend: Down 8.7% year-over-year.

Insight: City semis are absorbing inventory aggressively. If you are selling a semi in the 416, you are in a position of strength. In the 905, buyers are finding incredible value well under the $900k mark.


🏙️ Townhouses

Townhomes continue to be a battleground for buyers who are priced out of the detached market but want to avoid condo fees.

  • 416 (Toronto Core)

    • Average Price: $980,175.

    • Trend: Prices are down 4.6%, but sales volume was actually up 2.7% year-over-year. Just like semis, city townhomes are moving fast.

  • 905 (GTA Suburbs)

    • Average Price: $806,876.

    • Trend: Down 8.2% year-over-year.

Insight: The strong sales activity in the 416 shows that buyers are highly motivated to secure mid-priced urban homes. Suburbs are offering better pricing leverage, but city townhomes remain a highly coveted asset.


🏢 Condo Apartments

The condo market remains the most challenging segment for sellers, but it is an absolute goldmine for buyers right now.

  • 416 (Toronto Core)

    • Average Price: $663,984.

    • Trend: Prices fell 8.1%, and sales volume dropped over 12%. With over 4,500 active listings in the city and only 733 sales, buyers have total control.

  • 905 (GTA Suburbs)

    • Average Price: $549,563.

    • Trend: Down 10.1% year-over-year.

Insight: This is a textbook buyer's market. For renters looking to make the leap into homeownership, or investors looking for long-term holds, the condo market is offering the most affordable entry points we've seen in years. Sellers must be meticulous with staging and aggressive with pricing to stand out in a sea of inventory.


Final Thoughts & Recommendations

February 2026 is a story of tightening supply. With a massive 17.7% drop in new listings, sellers are holding out for better days, but this might be a mistake.

For Sellers: If you have a low-rise home in the 416 (especially a semi or townhome), demand is surprisingly strong. However, if you are selling a condo, you are competing against a backlog of inventory. You need a flawless marketing strategy and realistic pricing from day one.

For Buyers: The clock is ticking. With new listings falling and 100,000 buyers waiting for the right moment, the window to negotiate deep discounts, especially in the condo and detached markets, could close by the second half of the year.

Want a personalized pricing strategy for your property?

Let’s chat and position your home ahead of the market, not behind it.

📞 Call us at 416-886-2000 or visit:
GTALuxuryHomes.ca
The4sale.com
Ali.Realtor 
learn more or book a a complimentary consultation.

Read

The 2026 Outlook: Finding Your Sanctuary in a Shifting Market

The GTA housing market has finally found its breath. After years of relentless movement, 2026 brings a "sober equilibrium"—a rare moment where the noise fades, and the signal becomes clear. With interest rates holding steady and a new era of "build wealth steady" replacing the frantic "get rich quick" mindset, the power has shifted back to the diligent buyer and the patient renter.

The Signal in the Noise: A Window of Stabilization

We are currently living through a rare pause in the relentless price climbs of the last decade. The "Macro-to-Micro" effect is real: global trade pivots are acting as a cushion against economic shocks, creating a unique window for those looking to secure their next home. This is not a market for the desperate; it is a market for the prepared.

The Trade Squeeze and the Canadian Shield

Our economy is currently navigating a "Trade Squeeze". While US tariffs have caused some pressure, Canada has built a "Shield" through new partnerships—including a $70B investment from the UAE and lowered tariffs on electric vehicles. This global balancing act keeps "hot money" away from Ontario, cooling the speculative fever and allowing for a more calm, authentic market temperature.

A Tale of Two Inflations

When you look at the data, you see two very different stories. "The Big Ticket" items are finally easing, with gasoline prices dropping significantly and shelter costs seeing their lowest rise in five years. However, "The Daily Cost" of living remains sticky. These high grocery and restaurant prices are quietly eating into down-payment savings, making it even more important to be strategic with your mortgage and rental choices.

The Central Bank: A Season of Certainty

The Bank of Canada has moved away from automatic rate cuts and into a "Wait and See" approach. The policy rate has found a stable floor at 2.25%, which experts agree is the bottom of this cycle. For the first time in years, you can plan your future with a sense of predictability rather than fear of the next rate hike.

The Mortgage Matrix: Your Strategic Bridge

In 2026, choosing a mortgage is about more than just a number; it is about creating a bridge to your future. While variable rates offer flexibility, many are choosing the 3-Year Fixed mortgage. This strategy provides absolute certainty through the upcoming 2026 trade reviews and allows you to renew in 2029 when the global path is much clearer.

The Rental Correction: From Stress to Success

The power dynamic has officially flipped in the rental market. We are seeing a 12-month slide in prices, with vacancy rates hitting 3.1%—the highest in decades. This has created a massive "Negotiation Gap". With more supply available, you are no longer just "lucky to find a place"—you are a client who deserves a space that fits your lifestyle.

Finding Value in the Ring

As the "softening premium" of the Downtown Core continues, savvy buyers are looking toward "The Value Ring". Areas like Mississauga, Vaughan, and Scarborough are offering 15-25% savings, allowing you to find a larger sanctuary without sacrificing connectivity.

The Horizon: A New Normal

The era of the "quick flip" is paused. As we look toward 2027 and beyond, we expect a transition into a "New Normal" defined by slow, steady appreciation and modest growth. The 2026 CUSMA review remains the biggest variable, but it also acts as a "cap" that keeps the market from returning to a frantic state.

Your Strategic Path Forward

This is a market for the prepared.

  • Buyers: Target investor-owned units where sellers are motivated by renewal pain.

  • Renters: Negotiate aggressively and use tools to build your credit through your rent payments.

  • Everyone: Keep a close eye on monthly inflation reports—they are your new crystal ball.


Download Your 2026 Diligent Buyer’s Roadmap

To help you navigate these trade winds, I have curated a strategic checklist for the modern buyer. This document covers everything from finding the "Value Ring" to leveraging the current "Negotiation Gap."

Click Here to Download: 2026_Diligent_Buyer_Checklist

Read

Market Watch January 2026: GTA Average Price Dips Below $1M as the Market Resets

Welcome to 2026! The Greater Toronto Area (GTA) housing market kicked off the new year with a noticeable chill, bringing both challenges for sellers and incredible opportunities for buyers.

According to the latest TRREB data, there were 3,082 home sales reported in January—a significant 19.3% drop compared to January 2025. But the real headline? The average selling price across the GTA has dipped below the $1 million mark, landing at $973,289 (down 6.5% year-over-year).

While new listings entering the market also decreased by 13.3% , month-over-month trends show prices and the MLS® HPI composite are continuing to trend lower. We are firmly in a market where pricing strategy is everything.

Here is a deep dive into how the 416 (City of Toronto) and 905 (Suburban GTA) markets performed by property type in January 2026.


🏡 Detached Homes

The detached market remains the gold standard for GTA living, but buyers are finding much more breathing room, especially outside the city core.

  • 416 (Toronto Core)

    • Average Price: $1,541,791.

    • Trend: Down 2.8% year-over-year. The city's detached market is holding its value better than the suburbs, though prices are still softening.

  • 905 (GTA Suburbs)

    • Average Price: $1,205,859.

    • Trend: Down 8.8% year-over-year.

Insight: The suburban premium has officially cooled. For families looking to upsize, the 905 region is offering substantial discounts compared to last year, making this a prime window to negotiate a forever home.


🏘️ Semi-Detached Homes

Semi-detached homes saw some of the most dramatic differences between the city and the suburbs this month.

  • 416 (Toronto Core)

    • Average Price: $1,146,188.

    • Trend: Down just 0.9% year-over-year. City semis remain incredibly resilient and highly sought-after.

  • 905 (GTA Suburbs)

    • Average Price: $840,356.

    • Trend: Down a massive 14.5% year-over-year.

Insight: If you are a first-time buyer or investor, suburban semis are flashing a massive "buy" signal. With average prices dropping to the mid-$800s in the 905, this segment represents some of the best value in the current market.


🏙️ Townhouses

Townhomes, often the "missing middle" of housing, saw a fairly even price correction across the board as affordability constraints continue to dictate buyer behavior.

  • 416 (Toronto Core)

    • Average Price: $876,585.

    • Trend: Down 6.7% year-over-year.

  • 905 (GTA Suburbs)

    • Average Price: $804,860.

    • Trend: Down 10.1% year-over-year.

Insight: The price gap between a city townhouse and a suburban townhouse has narrowed to roughly $70,000. Buyers who were previously pushed to the suburbs might find they can afford to stay in the 416 right now.


🏢 Condo Apartments

The condo sector continues to face headwinds. As inventory sits, sellers are being forced to aggressively adjust their expectations to get deals done.

  • 416 (Toronto Core)

    • Average Price: $631,932.

    • Trend: Down 8.6% year-over-year.

  • 905 (GTA Suburbs)

    • Average Price: $551,166.

    • Trend: Down 13.0% year-over-year.

Insight: Condo buyers currently have the luxury of choice and time. With 905 condos hovering near the $550k mark, the barrier to entry for homeownership is the lowest it has been in quite a while. Sellers in this space must ensure their units show perfectly and are priced competitively from day one.


Final Thoughts & Recommendations

The January 2026 data confirms what we've been feeling on the ground: we are in a challenging, price-sensitive market.

For Sellers: You cannot look in the rearview mirror to price your home. With both sales and prices trending downward, you must price ahead of the market, not chase it down. Properly priced, well-presented homes are still selling, but buyers are refusing to overpay.

For Buyers: This is your moment. With less competition and prices pulling back, you have excellent negotiating power. Whether you are looking for a heavily discounted suburban semi or a starter condo, the opportunities are there if you are ready to act.

Want a personalized pricing strategy for your property?

Let’s chat and position your home ahead of the market, not behind it.

Read

The Economics of Peace: Why Your Next Move Could Be Your Most Profitable Life Decision

By Ali | The Visionary Curator

What is the "Economics of Peace"?

A Strategic Definition for the Modern Homeowner

The Economics of Peace is a strategic real estate philosophy that prioritizes monthly liquidity and mental clarity over asset accumulation. In the current Southern Ontario market climate—specifically regarding the 2025-2026 mortgage renewal cycle—it involves liquidating "heavy" equity to eliminate debt. The goal is to transition from being "House Rich and Life Poor" to a state of financial fluidity, where your home serves your life, rather than your life serving your mortgage.


The Silent Weight of the 2026 Horizon

There is a specific kind of quiet that fills a home when the owner is worried about money. It’s a heaviness that settles in the hallways and creates a fog in the living room.

As we navigate the reality of 2026, many homeowners in the Greater Toronto Area are feeling this weight. We are seeing the effects of the mortgage renewal cycle that economists predicted years ago. If you purchased or refinanced during the historic lows, the new rates aren't just numbers on a page—they are a fundamental shift in your daily reality.

We need to normalize this conversation.

There is no virtue in suffering to keep a specific address. There is no award for enduring sleepless nights just to maintain a certain square footage. If your sanctuary has become a source of stress, the energy of the home has shifted. It is no longer a retreat; it is an obligation.

Curating vs. Accumulating: The Art of "Editing" Your Life

In my work as a curator of lifestyles, I often look to the art world. A master curator does not judge a collection by how much is in the room, but by the clarity of the pieces that remain.

Often, we view selling a family home as a "step back" or "downsizing." I invite you to view it differently. I invite you to view it as editing.

When you edit a room, you remove the clutter to let the light in. When you edit your real estate portfolio, you release the square footage you no longer need—the rooms you pay to heat, cool, clean, and insure—to reclaim something far more valuable: Your freedom.

This is not about loss. It is about refinement. It is about trading physical space for mental space.

The Mathematics of Serenity

Let’s put on our analytical hats for a moment and look at the logic. The numbers must make sense for the heart to feel at peace.

In this market, the "ROI" (Return on Investment) is usually calculated in dollars. But for the homeowner facing a steep renewal, the true ROI is Quality of Life.

Consider this equation:

  • The Current Path: You hold the asset. You endure the payment shock (which statistics show could be a 15-20% increase for many fixed-rate holders). Your monthly cash flow tightens. You say "no" to travel, "no" to dinners out, "no" to ease. You are building equity, but you are spending your peace to get it.

  • The "Economics of Peace" Path: You sell strategically. You unlock the equity trapped in the drywall and timber. You eliminate the debt. You move to a "Right-sized" space—perhaps a boutique condo near the water or a refined townhome.

Suddenly, the flow returns. Your bank account breathes. Your mornings are no longer started with anxiety. That is a profit that doesn't show up on a spreadsheet, but it is the most valuable profit you will ever make.

Your Narrative is Yours to Write

Societal pressure tells us that "bigger is better" and that the goal is always to climb the property ladder. But a ladder that leads to anxiety is not worth climbing.

You are the author of this narrative. You have the power to change the setting of your story to one that supports your well-being.

The market in Southern Ontario is shifting, and there are buyers currently looking for exactly the type of home you own. By selling now, you aren't "giving up." You are making a sophisticated, proactive choice to preserve your wealth and, more importantly, your wellness.

A Confidential Invitation

I understand that this is a sensitive topic. Real estate is deeply personal, and financial shifts are often private matters.

I am not just a salesperson; I am a guide. I offer a Confidential Strategy Session—think of it as a coffee chat, not a listing presentation. We will sit down, look at the reality of the market, and explore your options with zero pressure.

Let’s find your clarity.

Click Here to Request a Private Home Evaluation & Strategy Session


Frequently Asked Questions regarding 2026 Renewals

1. Is it better to refinance my current mortgage or sell? Refinancing allows you to keep your home, but it often extends your amortization period (meaning you pay interest for longer) or significantly increases your monthly payments at current rates. Selling triggers a "clean slate." The choice depends on your Monthly Liquidity Ratio: if keeping the home requires you to use credit cards for daily living, the asset has become a liability.

2. Will I pay a penalty if I sell before my mortgage term is up? This is a critical calculation. If you have a variable rate mortgage, the penalty is typically just three months' interest. If you have a fixed rate, you may face an "Interest Rate Differential" (IRD) penalty, which can be higher. However, when we run the numbers, the profit from selling often far outweighs the penalty—especially if it saves you thousands in monthly payments over the next 5 years.

3. What are the actual costs of "Rightsizing"? Transparency is key. When selling in Ontario, you should budget for Real Estate Commissions (to market and protect your asset), Legal Fees (approx. $1,500 - $2,000), and Mortgage Discharge fees ($300-$500). When buying your smaller sanctuary, remember Land Transfer Taxes. In our strategy session, I provide a Net Sheet that calculates every penny so there are no surprises.

4. Should I wait for interest rates to drop further before selling? Market timing is a dangerous game. While rates may fluctuate, the inventory of homes for sale is expected to rise as more owners face the 2026 renewal wall. Selling before the market becomes saturated with inventory often yields a higher sale price, which negates the benefit of waiting for a slightly lower rate on your next purchase.

Read

Market Watch December 2025: A Shift Towards Affordability and Recovery?

The Greater Toronto Area (GTA) housing market closed out 2025 with a clear message: affordability is improving, and the stage is being set for recovery. As economic uncertainty and elevated inventory levels weighed on consumer confidence throughout the year, we saw a cooling in sales volume and a downward negotiation on selling prices.

For buyers, this "challenging market" has created a unique window of opportunity. With the average selling price across the GTA dipping to $1,006,735 in December (down 5.1% year-over-year), improved affordability is finally becoming a reality. As TRREB President Daniel Steinfeld noted, once confidence in the economy and labour market solidifies, we expect pent-up demand to drive sales back up.

Here is a deep dive into how the 416 (City of Toronto) and 905 (Suburban GTA) markets performed by property type in December 2025.


🏡 Detached Homes

The detached market remains the premium segment, but buyers are finding significantly more room to negotiate than in previous years. Both the 416 and 905 regions saw price corrections, offering relief to families looking for more space.

  • 416 (Toronto Core)

    • Sales: 413 transactions.

    • Average Price: $1,498,079.

    • Trend: Prices in the city dropped by 4.5% year-over-year. While still the most expensive segment, this dip brings the entry point for city detached living slightly lower.

  • 905 (GTA Suburbs)

    • Sales: 1,277 transactions.

    • Average Price: $1,239,882.

    • Trend: The suburbs saw a steeper decline, with prices down 7.0% compared to last December. This suggests that the "exodus to the suburbs" premium has cooled, restoring better value for money in the 905.

Insight: If you are a move-up buyer, the gap between selling a smaller home and buying a detached property has narrowed, particularly in the 905 region.


🏘️ Semi-Detached Homes

Semi-detached homes often serve as the bridge between condos and detached living. In December 2025, this segment experienced the most significant price adjustments, particularly in the 416.

  • 416 (Toronto Core)

    • Sales: 122 transactions.

    • Average Price: $1,122,309.

    • Trend: A sharp year-over-year price decline of 12.2%. This correction makes semi-detached homes in the city one of the most attractive value propositions for buyers right now.

  • 905 (GTA Suburbs)

    • Sales: 201 transactions.

    • Average Price: $857,237.

    • Trend: Prices dropped by 9.9%. With an average price well under the $1M mark, 905 semis are a prime target for first-time buyers stretching their budgets.

Insight: The double-digit drop in the 416 suggests sellers must be incredibly sharp with pricing. Buyers in this segment are price-sensitive and willing to wait for the right deal.


🏙️ Townhouses

Townhouses presented a tale of two markets in December. While the suburbs followed the general cooling trend, the City of Toronto townhouse market showed unexpected resilience.

  • 416 (Toronto Core)

    • Sales: 127 transactions.

    • Average Price: $976,161.

    • Trend: Surprisingly, this was the only segment to show growth, with prices up 5.4% year-over-year. This indicates strong demand for freehold alternatives within the city limits.

  • 905 (GTA Suburbs)

    • Sales: 486 transactions.

    • Average Price: $832,199.

    • Trend: In contrast, the 905 saw prices decline by 9.0%. The significant price gap between a 416 and 905 townhouse (approx. $144k) is likely driving some buyers to look further afield for value.

Insight: The strength of the 416 townhouse market suggests that buyers who are priced out of detached homes are aggressively competing for these units, keeping prices buoyant.


🏢 Condo Apartments

The condo market continues to face headwinds with elevated inventory levels, allowing for selling prices to be negotiated downward. This sector remains the most affordable entry point into homeownership.

  • 416 (Toronto Core)

    • Sales: 694 transactions.

    • Average Price: $663,227.

    • Trend: Prices are down 7.2% year-over-year. With the average price sitting in the mid-$600s, affordability for singles and young professionals has improved noticeably.

  • 905 (GTA Suburbs)

    • Sales: 335 transactions.

    • Average Price: $555,110.

    • Trend: The suburban condo market softened further, with a 9.5% price drop. This brings the average price dangerously close to the $550k mark, offering exceptional value for investors or first-time buyers.

Insight: With listing inventory remaining elevated, condo buyers have the luxury of choice and time. Sellers must focus on presentation and strategic pricing to stand out in a crowded market.


Final Thoughts & Recommendation

The December 2025 statistics paint a picture of a market in transition. While sales are down 11.2% overall for the year , the "improved affordability" narrative is the silver lining that will likely spark the recovery.

For Buyers: The current climate allows you to negotiate selling prices downward. You have the leverage today that you may not have tomorrow once economic confidence returns.

For Sellers: The days of "listing and waiting for a bidding war" are paused. With inventory up and prices adjusting, you must price ahead of the market, not chase it down. As Jason Mercer, TRREB Chief Information Officer, noted, households need to be confident in their employment before committing, meaning your property needs to scream "value" and "security" to attract serious offers.

Want a personalized pricing strategy for your property?

Let’s chat and position your home ahead of the market—not behind it.

Read

Unlocking Your Next Real Estate Investment: A Guide to the CMHC MLI Select Program in the GTA

Introduction: A New Path for Toronto Real Estate Investors

For investors in the Greater Toronto Area, the rules of multi-unit real estate have fundamentally changed. Profitability is no longer just about location and market timing; it's about purpose. The government's most powerful financing tool, the CMHC MLI Select program, has been redesigned to directly link an investor's financial success to their project's social and environmental impact. This guide is your strategic playbook for mastering this new equation.

As a commercial mortgage broker specializing in CMHC financing, I will break down the core components of MLI Select, explain the critical new rules that took effect in 2025, and provide a clear blueprint for how you can leverage this program to achieve your financial goals while making a meaningful contribution to housing affordability and sustainability.

1. The Big Picture: Understanding the GTA's Current Rental Market

Before diving into the specifics of MLI Select, it's essential to understand the landscape you'll be operating in. The 2025 CMHC Rental Market Report revealed several key dynamics that every new investor in the GTA should be aware of.

  • Softening Market Conditions

    • An increase in rental supply combined with weaker demand from renters has caused vacancy rates to rise. For the first time since the pandemic, the vacancy rate for purpose-built rental apartments in Toronto reached 3.0%. For an investor, this means a slightly less frantic market, but also more competition to attract and retain tenants.

  • The Key Role of Tenant Turnover

    • While average rents for new tenants have stalled or even declined slightly, overall rent growth is still happening. The primary driver of this increase is tenant turnover. When a unit becomes vacant, landlords can reprice it to current market rates, which are often significantly higher than what a long-term tenant was paying. This makes managing turnover a critical part of a landlord's financial strategy in Toronto.

  • Competition from Condominiums

    • The GTA has seen a surge in condominium apartments being offered on the rental market. As the ownership market has weakened, many condo owners have opted to rent out their units instead of selling. This influx of newer, often well-located units adds significant competitive pressure to the traditional, purpose-built rental market.

  • Persistent Affordability Challenges

    • Despite the overall vacancy rate rising, the market for the most affordable rental units remains extremely tight. The vacancy rate for the least expensive units is under 1%, indicating that demand from lower-income renters far outstrips supply.

These trends highlight a core challenge: while the market is competitive, there is a clear and pressing need for specific types of housing, particularly affordable units. This is precisely the gap that the CMHC MLI Select program is designed to fill.

2. What is the CMHC MLI Select Program? A Powerful Tool for Investors

In simple terms, MLI Select is a mortgage loan insurance product offered by CMHC. Its core purpose is to incentivize private developers and investors to create multi-unit rental properties that help solve Canada's most pressing housing challenges: affordability, energy efficiency, and accessibility. In exchange for building projects that meet these social goals, CMHC provides insurance that unlocks exceptional financing terms from lenders.

For an investor, the benefits are transformative compared to conventional financing:

  • Higher Leverage

    • The program allows for a Loan-to-Value (LTV) or Loan-to-Cost (LTC) of up to 95%. This means you could potentially secure financing with a down payment as low as 5%, dramatically reducing the initial capital required to get a project off the ground.

  • Longer Amortization

    • MLI Select offers amortization periods of up to 50 years. A longer amortization significantly lowers monthly mortgage payments, which improves your property's monthly cash flow and makes projects more financially viable, especially in the early years.

  • Better Financing Terms

    • Because CMHC insurance protects the lender against default, lenders can offer lower interest rates and reduced insurance premiums compared to conventional commercial loans. This reduces the overall cost of borrowing over the life of the mortgage.

These powerful incentives are not automatic. To unlock them, your project must score points in a system designed to measure its social and environmental impact.

3. The Heart of the Program: Mastering the MLI Select Points System

The entire MLI Select program is built on a points system. The more points your project scores, the better the financing terms you can access. To qualify, a project must achieve a minimum of 50 points, but savvy investors aim for 100+ points to maximize their benefits. Points are awarded across three "pillars":

  • Affordability

    • This is achieved by committing to rent a certain percentage of your units at or below 30% of the local median renter income. This commitment must be maintained for at least 10 years.

  • Energy Efficiency

    • Points are awarded for designing a new building or retrofitting an existing one to achieve energy consumption and GHG emission reductions that exceed the standards of the National Energy Code.

  • Accessibility

    • This involves incorporating universal design principles and accessibility features for people with mobility challenges, based on standards like the CSA B651:23. This can range from making common areas barrier-free to ensuring a percentage of units are fully accessible.

Illustrate the Tiers of Success

For a new construction project, the benefits scale directly with your point score. The strategic goal is to reach 100 points to unlock the best possible terms.

Minimum Points Required

Key Benefits Unlocked

Strategic Goal

50 Points

Qualify for the program. Up to 95% LTC, up to 40-year amortization.

The entry-level tier.

70 Points

Improved terms. Up to 95% LTC, up to 45-year amortization.

A stronger project with better cash flow.

100+ Points

Maximum benefits. Up to 95% LTC, up to 50-year amortization, and access to limited recourse debt.

The strategic target for savvy investors.

A Strategic Blueprint for Success

Reaching 100 points is more achievable than it might seem, especially when you leverage long-term commitments. Here is a cost-effective "100-Point Blueprint" for a hypothetical 12-unit new construction project in Toronto:

  1. Pillar 1: Affordability (80 Points)

    • Commit just 10% of your units (2 out of 12) to affordable rents. This initial commitment earns 50 points.

    • Critically, commit to maintaining these affordable rents for 20+ years instead of the minimum 10. This long-term commitment grants a +30 point bonus.

    • Total Affordability Score: 80 Points

  2. Pillar 2: Accessibility (20 Points)

    • Design the building to meet the mandatory accessibility baseline: 100% of units must be "visitable" and all common areas must be barrier-free, as defined by the CSA B651:23 standard.

    • Ensure a minimum of 15% of the total units (2 out of 12) are fully accessible according to CSA standards. This combination earns 20 points.

    • Total Accessibility Score: 20 Points

  3. Pillar 3: Energy Efficiency (0 Points)

    • With 100 points already achieved through affordability and accessibility, no additional points are needed from this pillar. This allows you to build to the standard 2020 National Building Code without incurring the extra costs associated with higher-tier energy efficiency measures.

This strategic approach allows an investor to unlock the maximum financing benefits while minimizing additional construction costs. Understanding this points system is the first step; the next is navigating the new cost structure that CMHC introduced in 2025.

4. The New Math (Post-July 2025): How Your Premium is Calculated

For applications submitted on or after July 14, 2025, CMHC overhauled its premium structure for multi-unit mortgage insurance. It is now essential for investors to understand this new "risk-based" pricing to accurately model a project's financial returns. The final premium you pay is now a three-part calculation.

  1. Base Premium Rate

    • This is your starting point. The rate is determined primarily by your project's risk, which CMHC measures through the Loan-to-Value (LTV) or Loan-to-Cost (LTC) ratio and whether it's a new construction or an existing property. Simply put: the higher your leverage, the higher your base premium.

  2. Applicable Surcharges

    • Additional fees are added on top of the base premium for certain features that increase the loan's risk. The most common surcharge is for extended amortization periods. Any amortization beyond 25 years will have a surcharge added.

  3. MLI Select Discount

    • This is your reward for achieving social outcomes. Based on your project's point score, a percentage discount is subtracted from the total of your Base Premium and Surcharges. The discounts are:

      • 50 Points: 10% discount

      • 70 Points: 20% discount

      • 100+ Points: 30% discount

Show, Don't Just Tell

The power of aiming for 100 points becomes clear when you compare two financial models. Let's look at a "Minimum Viable" 50-point project versus a "Strategic Max-Out" 100-point project.

Metric

Project A (50 Points)

Project B (100 Points)

LTC / Amortization

85% / 40 years

95% / 50 years

Base Premium

6.00%

7.00%

Amortization Surcharge

+0.75%

+1.25%

Unstabilized Income Surcharge

+0.25%

+0.25%

Total Raw Premium

7.00%

8.50%

MLI Select Discount

-10% (-0.70%)

-30% (-2.55%)

FINAL PREMIUM

6.30%

5.95%

The "So What?"

The table reveals a crucial insight: the 100-point strategy is financially superior. Even though Project B uses higher leverage (95% vs. 85%) and a longer amortization (50 vs. 40 years)—both of which increase the raw premium—the powerful 30% discount results in a lower final premium rate. An investor using the 100-point strategy puts less money down, improves their monthly cash flow, and—counter-intuitively—still pays less in total insurance costs. This is the new math of purpose-driven investment.

5. The Gates to Entry: Verifying Borrower and Project Eligibility

Before you can even begin scoring points, you and your project must meet CMHC's fundamental eligibility requirements. These are the non-negotiable gates to entry.

Borrower Requirements Checklist

  • Experience: You must have a minimum of 5 years of experience managing similar multi-unit residential properties.

    • Alternative: If you lack this experience, you can satisfy the requirement by having a formal contract with a professional third-party property management firm.

  • Net Worth: You must have a minimum net worth equal to at least 25% of the total loan amount, with an absolute minimum of $100,000.

    • Strategic Note: CMHC may offer flexibility on this requirement for projects that achieve 100+ points.

Project Requirements Checklist

  • Minimum Size: The property must have at least 5 rental units.

  • Mixed-Use Limits: If the property includes commercial space (e.g., retail on the ground floor), the non-residential portion cannot exceed 30% of the gross floor area or 30% of the total lending value.

  • Foreign Ownership: The project cannot be subject to the Prohibition on the Purchase of Residential Property by Non-Canadians Act.

Once you've confirmed you meet these baseline criteria, you can move forward with the application process.

6. The Application Roadmap: A 5-Step Process from Submission to Funding

The application process for an MLI Select-insured loan is thorough and requires careful planning. Understanding the timeline and key milestones is crucial for managing expectations.

  1. Initial Application & Deposit

    • Submit your application forms and signed attestations (for affordability, accessibility, etc.) to a CMHC-approved lender. At this stage, you will pay the initial application deposit and application fees (calculated based on the number of units).

  2. Lender Financial Review (Approx. 10-14 days)

    • The lender performs its own due diligence. They will review your financials, analyze the project's pro forma, and ensure the deal is viable before submitting it to CMHC.

  3. CMHC Review & Final Deposit (Approx. 3-6 months)

    • Once the lender approves the package, it is sent to CMHC for their detailed review. This is the longest part of the process. A second deposit payment is typically due at this stage.

  4. Approval & Construction Draws

    • Upon successful review, CMHC issues a Certificate of Insurance. This is the official approval. The loan is finalized, and if it's a new build, construction draws can begin.

  5. Completion & Final Attestations

    • After construction is complete, you must provide the final signed attestations from qualified professionals (e.g., an energy advisor or architect) to your lender. This must be done within 60 days of the final loan disbursement to confirm you've met your commitments.

7. Conclusion: Your Blueprint for a Successful Investment

The CMHC MLI Select program represents a fundamental shift in how multi-unit rental projects are financed in the GTA. It is a strategic tool where financial success is directly linked to achieving positive social and environmental outcomes. The days of treating affordability or accessibility as optional add-ons are over; under the new 2025 rules, they are the core drivers of profitability.

For new investors, the path to success is clear: engage in careful, early-stage planning. Model your project to achieve 100 points from day one. By strategically leveraging the long-term affordability commitment and baseline accessibility standards, you can unlock the program's maximum benefits—higher leverage, longer amortization, and lower premiums—creating a more resilient and profitable investment for your future.

Read

Your 2026 Guide to Buying a Home in the GTA: How New Rebates Can Save You $130,000

1. Introduction: Turning Toronto Homeownership Dreams into Reality

For many aspiring first-time home buyers, the Greater Toronto Area (GTA) housing market can feel impossibly out of reach. The dream of ownership often seems to clash with the reality of high prices and intense competition. However, a unique window of opportunity is opening in 2026, driven by a combination of key market shifts and the most significant government incentives seen in recent memory.

This guide provides a clear, step-by-step roadmap for navigating the 2026 GTA market. Its purpose is to demystify the powerful new federal and provincial rebate programs that can dramatically increase your purchasing power and turn the dream of homeownership into a practical, achievable plan.

2. The 2026 GTA Real Estate Landscape: A First-Time Buyer's Perspective

After a significant decline in sales volume in 2023, the Ontario housing market stabilized through 2024, creating a more balanced environment for buyers. For first-time home buyers (FTHBs), condominiums in particular represent a key opportunity to enter the market.

Market data reveals several important trends:

Condos Are Leading the Recovery: In the 12 months leading up to June 2024, condo sales volumes recovered faster than other property types, showing an 8.3% year-over-year increase.

Condos Are the FTHB Entry Point: In the first half of 2024, condo properties accounted for a significant 43.9% of all purchases made by first-time home buyers.

A Price Opportunity Exists: Condo prices across the GTA have cooled, creating a potential buying advantage. While the City of Toronto saw a modest 5.1% year-over-year decline in the third quarter of 2025, surrounding regions experienced even more dramatic drops. Halton region saw condo prices fall by 12.1% and Peel region by 11.5% in the same period, powerfully reinforcing the case for looking beyond the downtown core.

First-time buyers have proven to be a resilient and stable segment of the market, consistently comprising between 20% and 23.6% of all property purchases since 2011. While Toronto remains the top destination for FTHBs, accounting for approximately 20% of activity, its popularity is waning due to affordability challenges. This has led a growing number of buyers to explore surrounding GTA regions like Peel, York, and Durham, as well as emerging communities like Waterloo, in search of better value.

3. The Game-Changer: Unlocking Up to $130,000 in New Home Rebates

The single biggest financial benefit for first-time buyers in 2026 is a set of new, coordinated Harmonized Sales Tax (HST) rebates from the federal and provincial governments. Aimed at buyers of newly built homes, these programs can dramatically reduce the upfront cost of a purchase.

3.1. The Federal First-Time Home Buyers’ GST Rebate

The Government of Canada has proposed a new rebate that removes the 5% federal portion of the HST—the Goods and Services Tax (GST)—for qualifying first-time home buyers purchasing new homes. This measure provides substantial savings directly at the point of purchase.

Metric
Value
Explanation
Example New Home Price
$900,000
A common price point for new condos in the GTA.
Federal GST (5%)
$45,000
The tax applied before the rebate.
FTHB GST Rebate
-$45,000
The full 5% is rebated.
Potential Federal Savings
$45,000
This amount is effectively removed from the purchase cost.

3.2. Ontario's Matching HST Rebate

The Ontario government has announced its intention to match the federal initiative by rebating the full 8% provincial portion of the HST on qualifying new homes priced up to $1 million.

Crucially, this provincial rebate is conditional. It will only proceed if the federal government's proposed changes to the GST are formally passed into law.

This new program works by enhancing Ontario's existing HST New Housing Rebate. The previous rebate was worth up to $24,000; the new program, when combined with the old one, ensures the full 8% provincial tax is rebated on qualifying new homes up to the $1 million threshold.

3.3. Putting It All Together: A Hypothetical Example

The combined impact of the federal and provincial rebates is transformative. For a first-time buyer purchasing a new home at the $1 million price point, the entire 13% HST could be eliminated, resulting in a six-figure savings.

Example: Combined Savings on a $1,000,000 New Home

Line Item
Amount
Description
Purchase Price
$1,000,000
The builder's price for a new home.
Federal GST (5%)
+$50,000
The federal tax portion.
Provincial HST (8%)
+$80,000
The provincial tax portion.
Price Including Taxes
$1,130,000
Total cost before rebates.
Federal GST Rebate
-$50,000
Maximum federal savings.
Provincial HST Rebate
-$80,000
Maximum provincial savings.
Total Potential Savings
$130,000
The combined value of the new rebates.
Final Price Before Other Costs
$1,000,000
The taxes are effectively removed for the FTHB.

3.4. Are You Eligible? Key Criteria for the Rebates

To qualify for these new HST/GST rebates, you and the home you are purchasing must meet specific criteria.

Who Qualifies:

    ◦ You must be a first-time home buyer, defined as not having owned a home you (or your spouse/common-law partner) lived in within the last four calendar years.

    ◦ You must be at least 18 years old and a Canadian citizen or permanent resident.

What Homes Qualify:

    ◦ The property must be a newly built home or a substantially renovated home. Resale properties do not qualify.

    ◦ The home must be intended for use as your primary place of residence.

Important Timing:

    ◦ The rebates apply to purchase agreements entered into on or after May 27, 2025, and before 2031.

4. Your Practical Roadmap to Homeownership in 2026

With this new landscape in mind, here are four actionable steps to begin your journey.

4.1. Step 1: Secure Your Financing

The first and most critical step is to get pre-approved for a mortgage. This will give you a clear understanding of your budget and show sellers and builders that you are a serious buyer. For first-time buyers in urban areas like the GTA, the Big 5 Banks are the dominant lenders, accounting for 70% of all FTHB financing activity in the first half of 2024.

4.2. Step 2: Understand Your Costs and Savings

Beyond your down payment, you will need to budget for closing costs, which include legal fees and land transfer tax. The new HST/GST rebates, offering up to $130,000 in savings, are a massive benefit that can significantly offset these upfront costs. It’s also important to remember that as a first-time buyer in Ontario, you already benefit from the provincial Land Transfer Tax Rebate, which further reduces your closing expenses.

4.3. Step 3: Find an Expert Guide

The 2026 market is defined by new opportunities and complex programs. It is essential to work with a real estate agent and a mortgage broker who specialize in the first-time home buyer market. An expert guide will be deeply familiar with the eligibility rules and application processes for these new rebates, ensuring you can maximize your savings.

4.4. Step 4: Focus Your Search

Use the current market data to your advantage. Condos are the most accessible entry point into the market, and the recent cooling of condo prices presents a strategic opportunity to buy. To get the most for your budget, broaden your search beyond Toronto's core. Regions like Halton and Peel have recently seen double-digit declines in condo prices (down 12.1% and 11.5% year-over-year, respectively), creating significant buying opportunities that are increasingly popular with first-time buyers.

5. Conclusion: Your Window of Opportunity is Open

The current market—defined by stabilizing prices and unprecedented government rebates for new builds—presents a rare and powerful opportunity for determined first-time buyers in 2026. The potential savings of up to $130,000 represents a direct government investment in your homeownership journey, making it more attainable than it has been in years.

Start your research, get pre-approved, and connect with a professional who can help you navigate these game-changing programs. Your dream of owning a home in the GTA is closer than you think.

Read

The "Wait and See" Trap: Why November’s Dip is the Golden Window First-Time Buyers Have Been Praying For

Is the market crashing, or is it correcting? If you are a First-Time Home Buyer sitting on the sidelines, the difference between those two words could be worth tens of thousands of dollars to your future net worth.

The November 2025 numbers are in, and the story they tell is one of opportunity. While the headlines scream about sales dropping, the savvy observer sees something else: leverage.

Here is the breakdown of what happened in the Greater Toronto Area (GTA) real estate market this month, how the "416" compares to the "905," and why the window to get in at a discount might be closing faster than you think.

The Big Picture: Buyers Are Pausing, But Should You?

In November 2025, we saw 5,010 home sales, which is down 15.8% compared to last year. At the same time, the average selling price dipped by 6.4% to $1,039,458.

What does this mean? It means intending homebuyers are sitting on the sidelines, waiting for "more positive economic news". But here is the secret: once that "positive news" arrives and confidence strengthens, everyone will rush back into the market at the same time, driving prices up.

Currently, we have a unique combination of factors working in your favor:

  • Lower Borrowing Costs: The Bank of Canada Overnight Rate has dropped to 2.3%.

  • More Inventory: Active listings are up 16.8% year-over-year.

  • Less Competition: With sales down, you aren't fighting 20 other offers on offer night.

The Breakdown: 416 (Toronto) vs. 905 (Suburbs)

Real estate is hyper-local. A condo in downtown Toronto acts differently than a detached home in the suburbs. Let’s look at the prices by property type to see where the value lies.

Detached Homes: The Crown Jewel

If you are looking for the white picket fence, prices have softened, making the upgrade more attainable.

  • 416 (Toronto): Average price is $1,545,941 (Down 9.0%).

  • 905 (Suburbs): Average price is $1,275,289 (Down 7.9%).

  • Market Insight: Detached homes in the 416 saw sales drop by 16.0%, creating significant negotiating room for buyers.

Semi-Detached: The Competitive Middle Ground

  • 416 (Toronto): Average price is $1,187,111 (Down 4.8%).

  • 905 (Suburbs): Average price is $853,916 (Down 11.0%).

  • Market Insight: Note the massive gap here. You can save over $330,000 by crossing the border into the 905 for a semi-detached home. The 905 Semis took a double-digit price hit (-11.0%), making this a prime target for value hunters.

Townhouses: The First-Time Buyer Favorite

  • 416 (Toronto): Average price is $870,793 (Down 3.7%).

  • 905 (Suburbs): Average price is $822,549 (Down 7.4%).

  • Market Insight: The price gap here is narrow (approx. $48k). If you work downtown, the premium to stay in the 416 might actually be worth the commute savings.

Condo Apartments: The Entry Point

  • 416 (Toronto): Average price is $701,259 (Down 1.7%).

  • 905 (Suburbs): Average price is $583,547 (Down 8.7%).

  • Market Insight: Condo sales took the biggest hit, down over 21% across the board. With 905 condos averaging well under $600k, this is the most accessible entry point we have seen in years.

Critical Advice for November 2025

For First-Time Home Buyers (FTHB)

This is your "Goldilocks" moment. We are seeing encouraging news on jobs and the broader economy. If this momentum continues into 2026, consumer confidence will return, and prices will rise.

You have a chance right now to buy while inventory is high (24,549 active listings) and rates are trending down. Do not wait for the competition to wake up.

Are You Financially Ready to Strike?

Before you start booking showings, you need to know your numbers. Can you handle the deposit? Do you know your credit score?

  • Check Your Readiness: Visit our Financial Readiness Guide to calculate your budget and understand the hidden costs of closing.

The Bottom Line

The Toronto Regional Real Estate Board President, Elechia Barry-Sproule, put it best: buyers are on the sidelines waiting for confidence.

Be the buyer who acts on data, not just confidence.

If you are ready to stop renting and start owning, let’s look at the numbers for your specific neighborhood. The window is open, but it won't stay open forever.

Read
This website may only be used by consumers that have a bona fide interest in the purchase, sale, or lease of real estate of the type being offered via the website. The data relating to real estate on this website comes in part from the MLS® Reciprocity program of the PropTx MLS®. The data is deemed reliable but is not guaranteed to be accurate.