RSS

Waiting for a better deal? Fewer sellers are left to offer one

Published August 23, 2026 · Last updated August 23, 2026

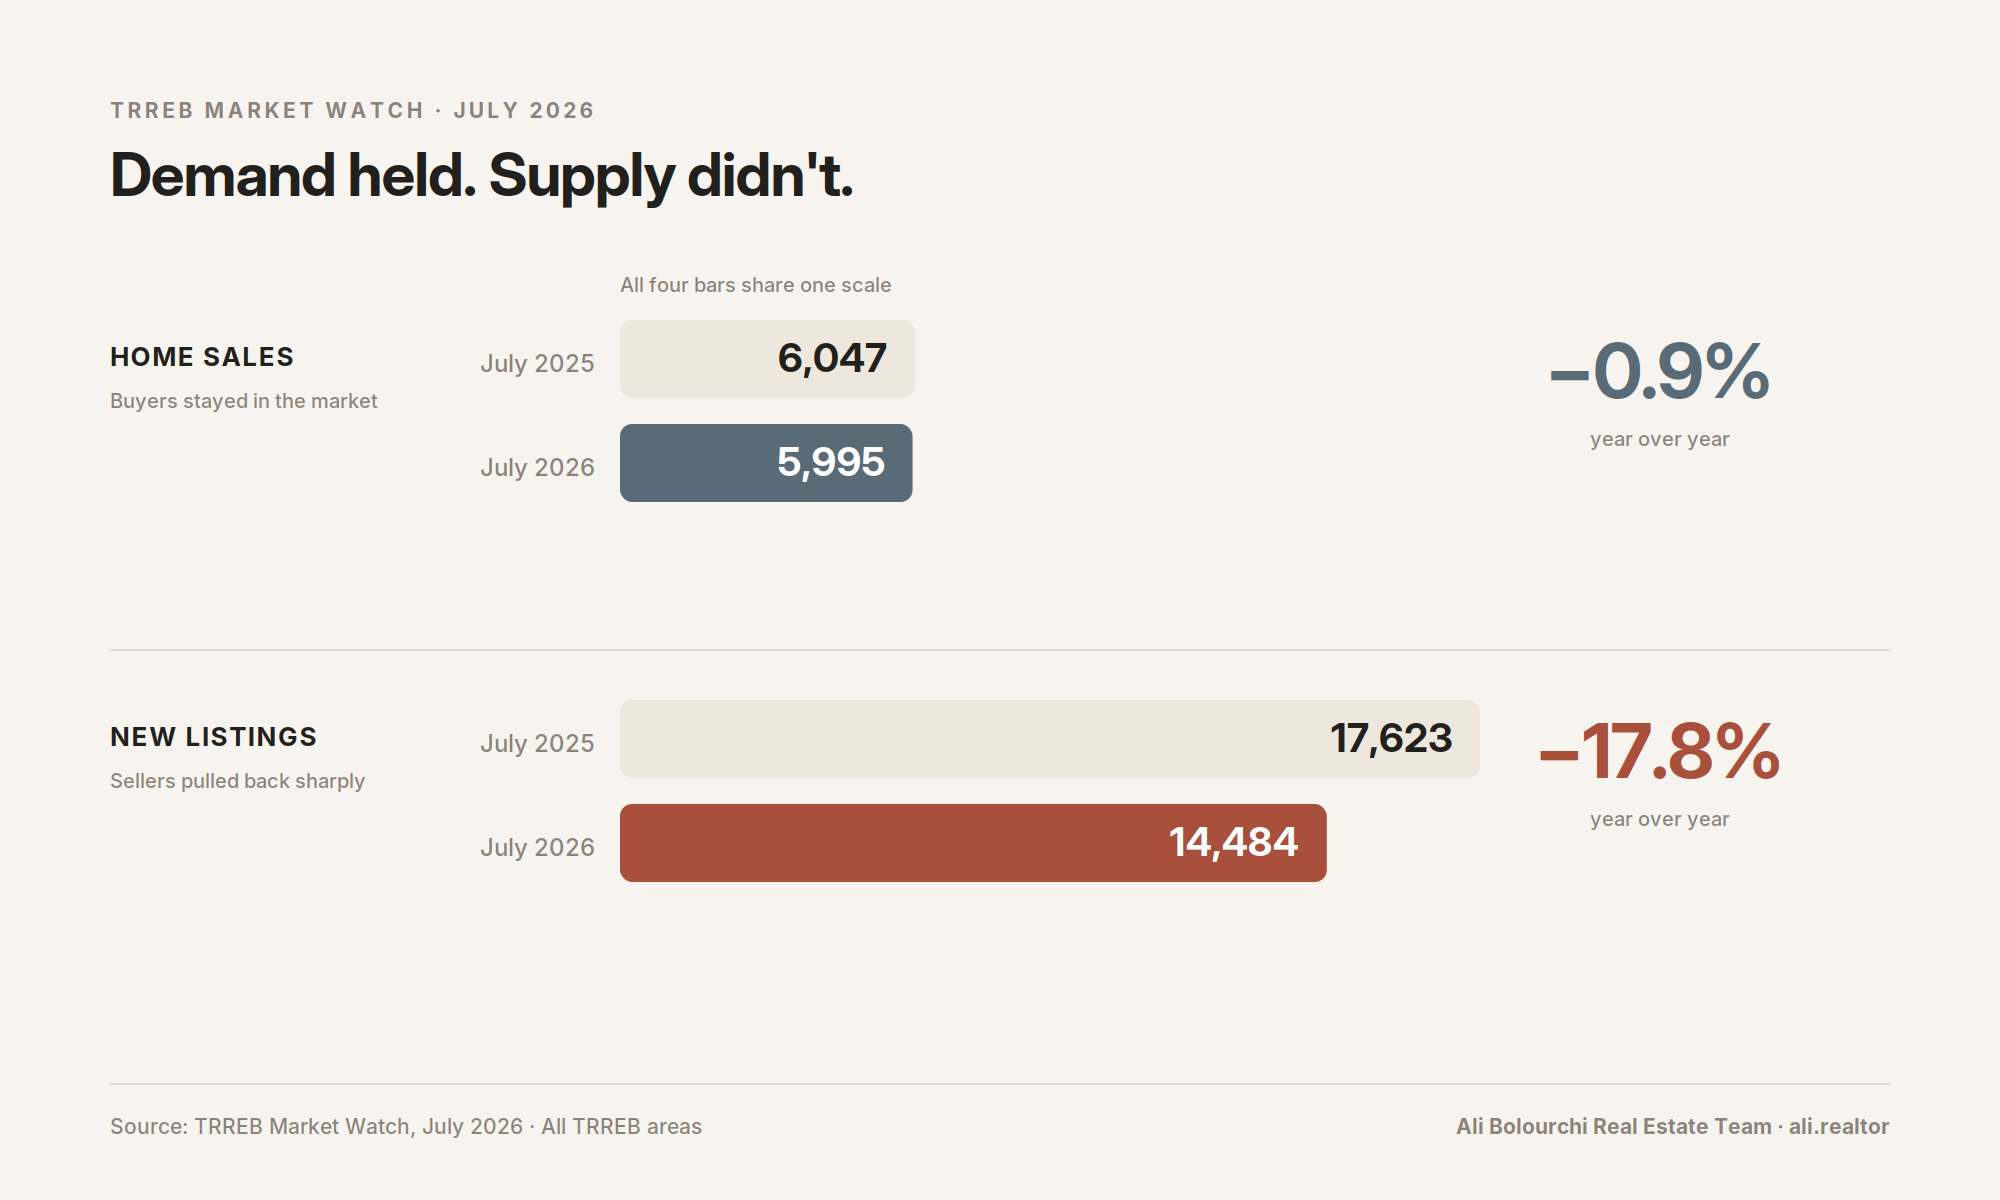
GTA new listings fell 17.8 per cent in July 2026, to 14,484, while sales fell only 0.9 per cent. Supply is leaving this market far faster than demand is. If you are waiting for a motivated seller, there are measurably fewer of them every month. Source: Toronto Regional Real Estate Board, Market Watch, released August 6, 2026.

Almost every piece of GTA market commentary this summer has been about interest rates. That story is well covered, including on this site. The story nobody is telling is quieter and, for anyone deciding when to move, more useful.

Sellers are leaving faster than buyers.
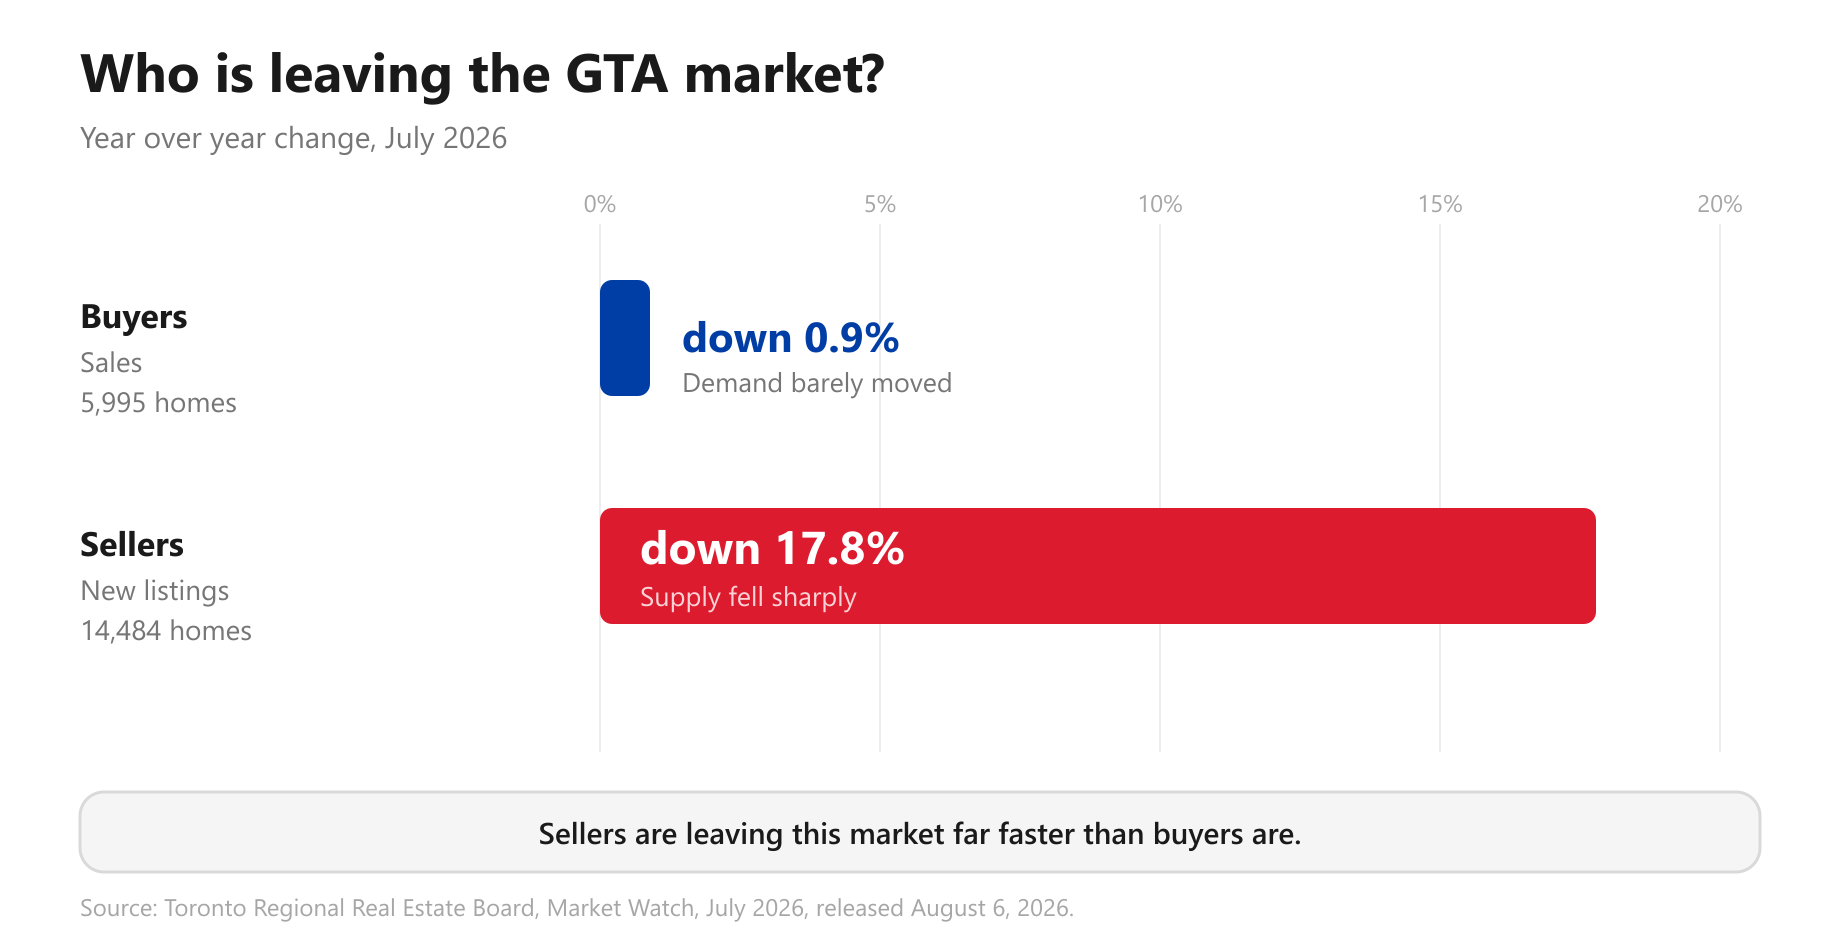
How much faster are sellers leaving than buyers?

Here is the July 2026 picture, as published.
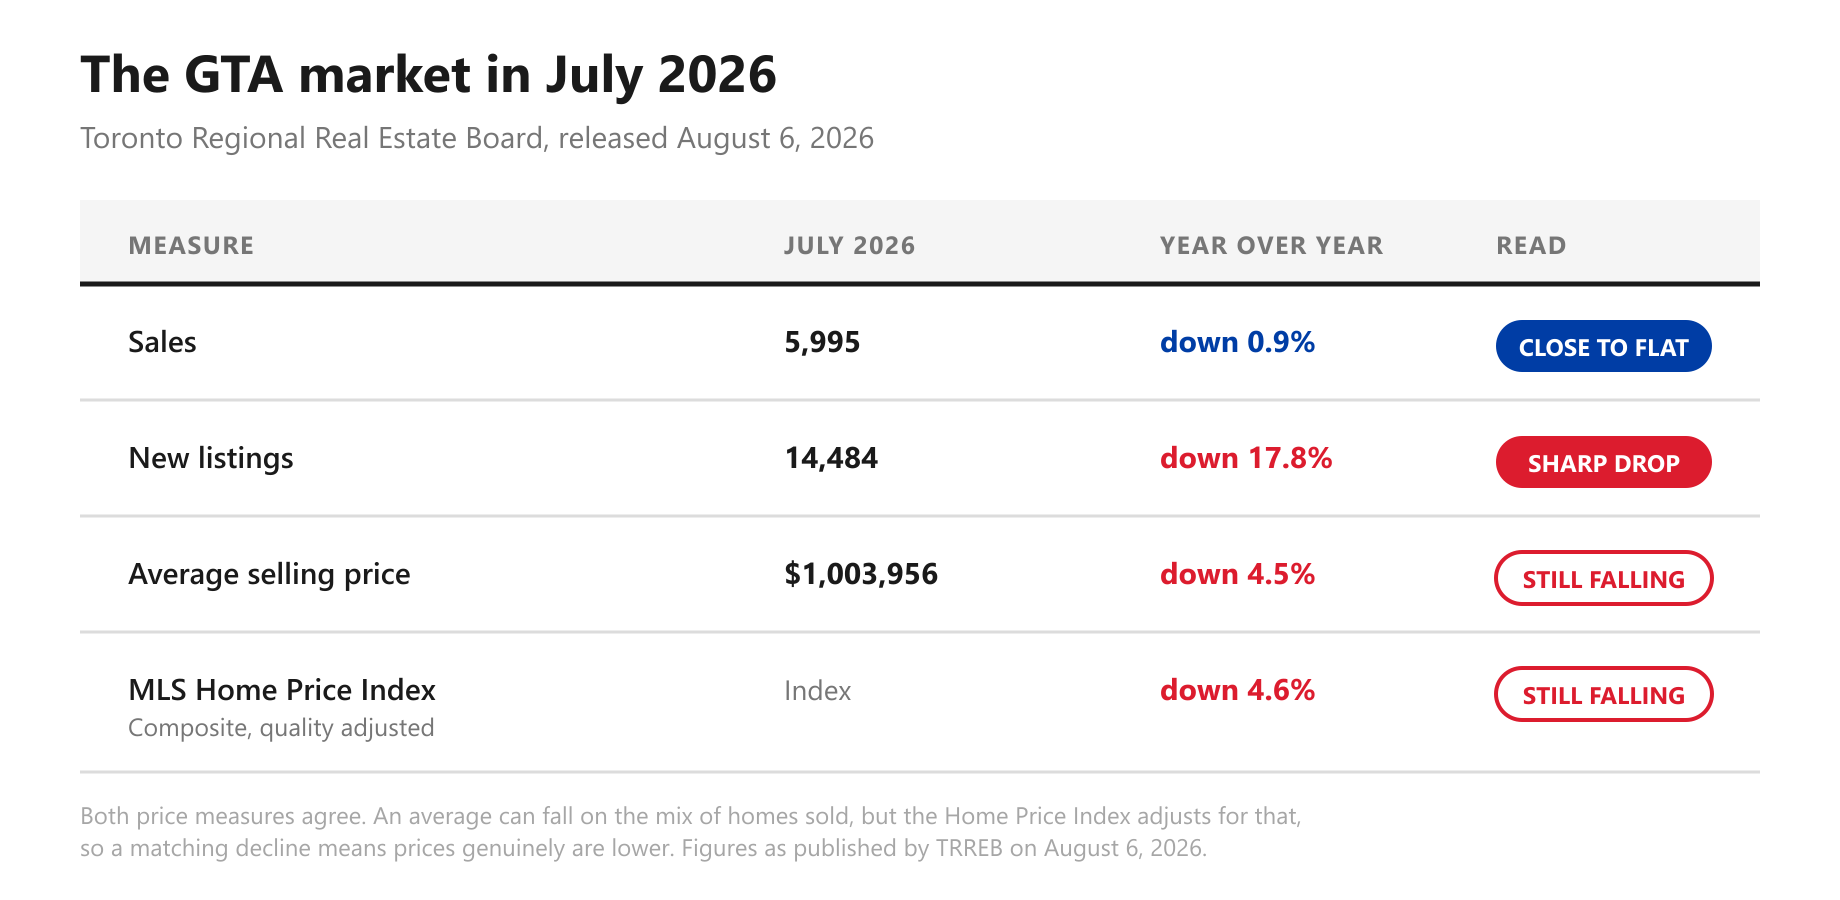
Read the two middle rows together. Sales are down 0.9 per cent year over year, which is close to flat. New listings are down 17.8 per cent. Demand barely moved. Supply fell off a cliff.

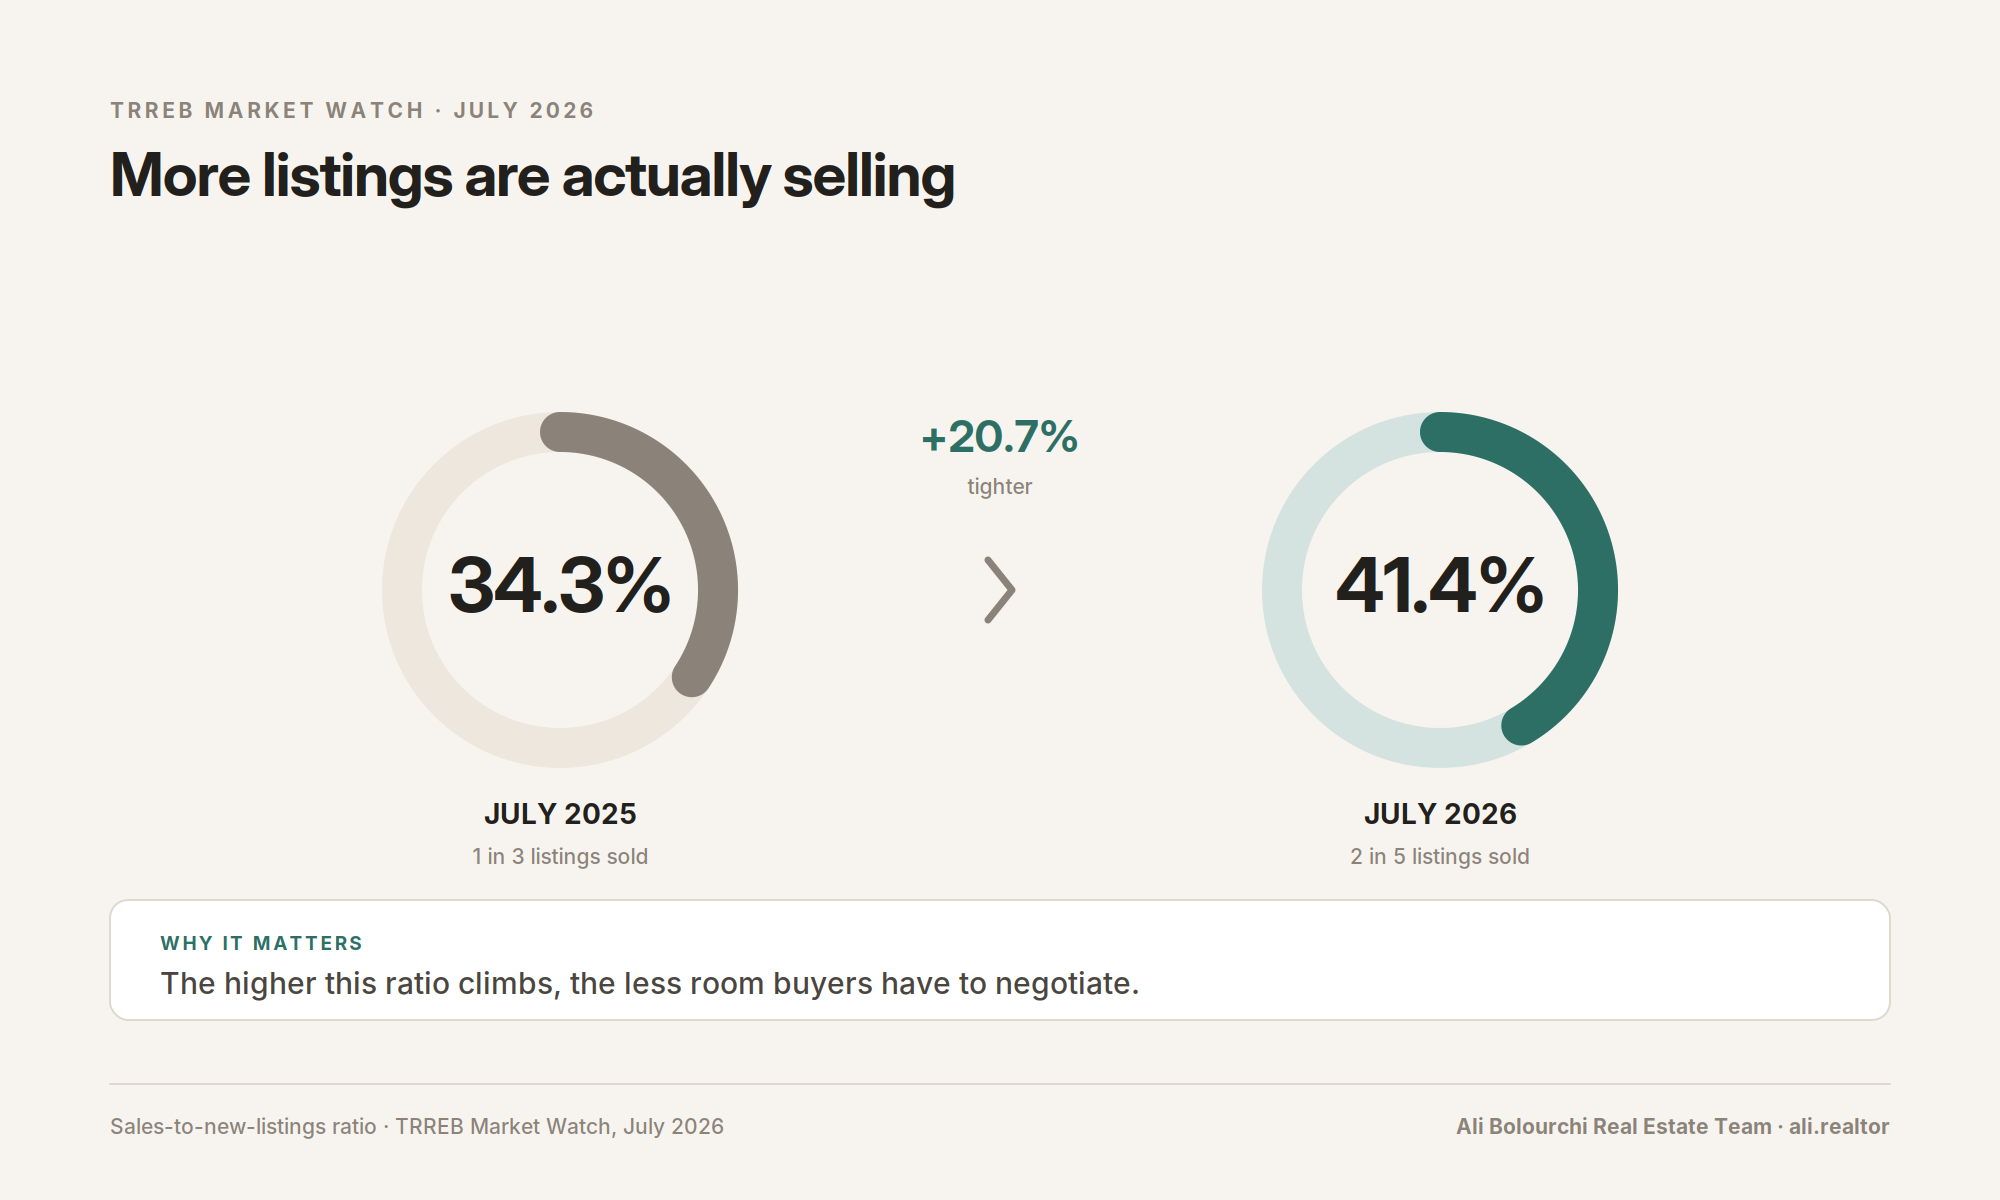
That gap has a consequence you can measure. In July 2026, sales represented 41.4 per cent of new listings, calculated from the two published figures. Applying TRREB’s own stated year over year changes to July 2025 puts the same ratio near 34 per cent. That is roughly seven percentage points of tightening in twelve months, with demand essentially unchanged.
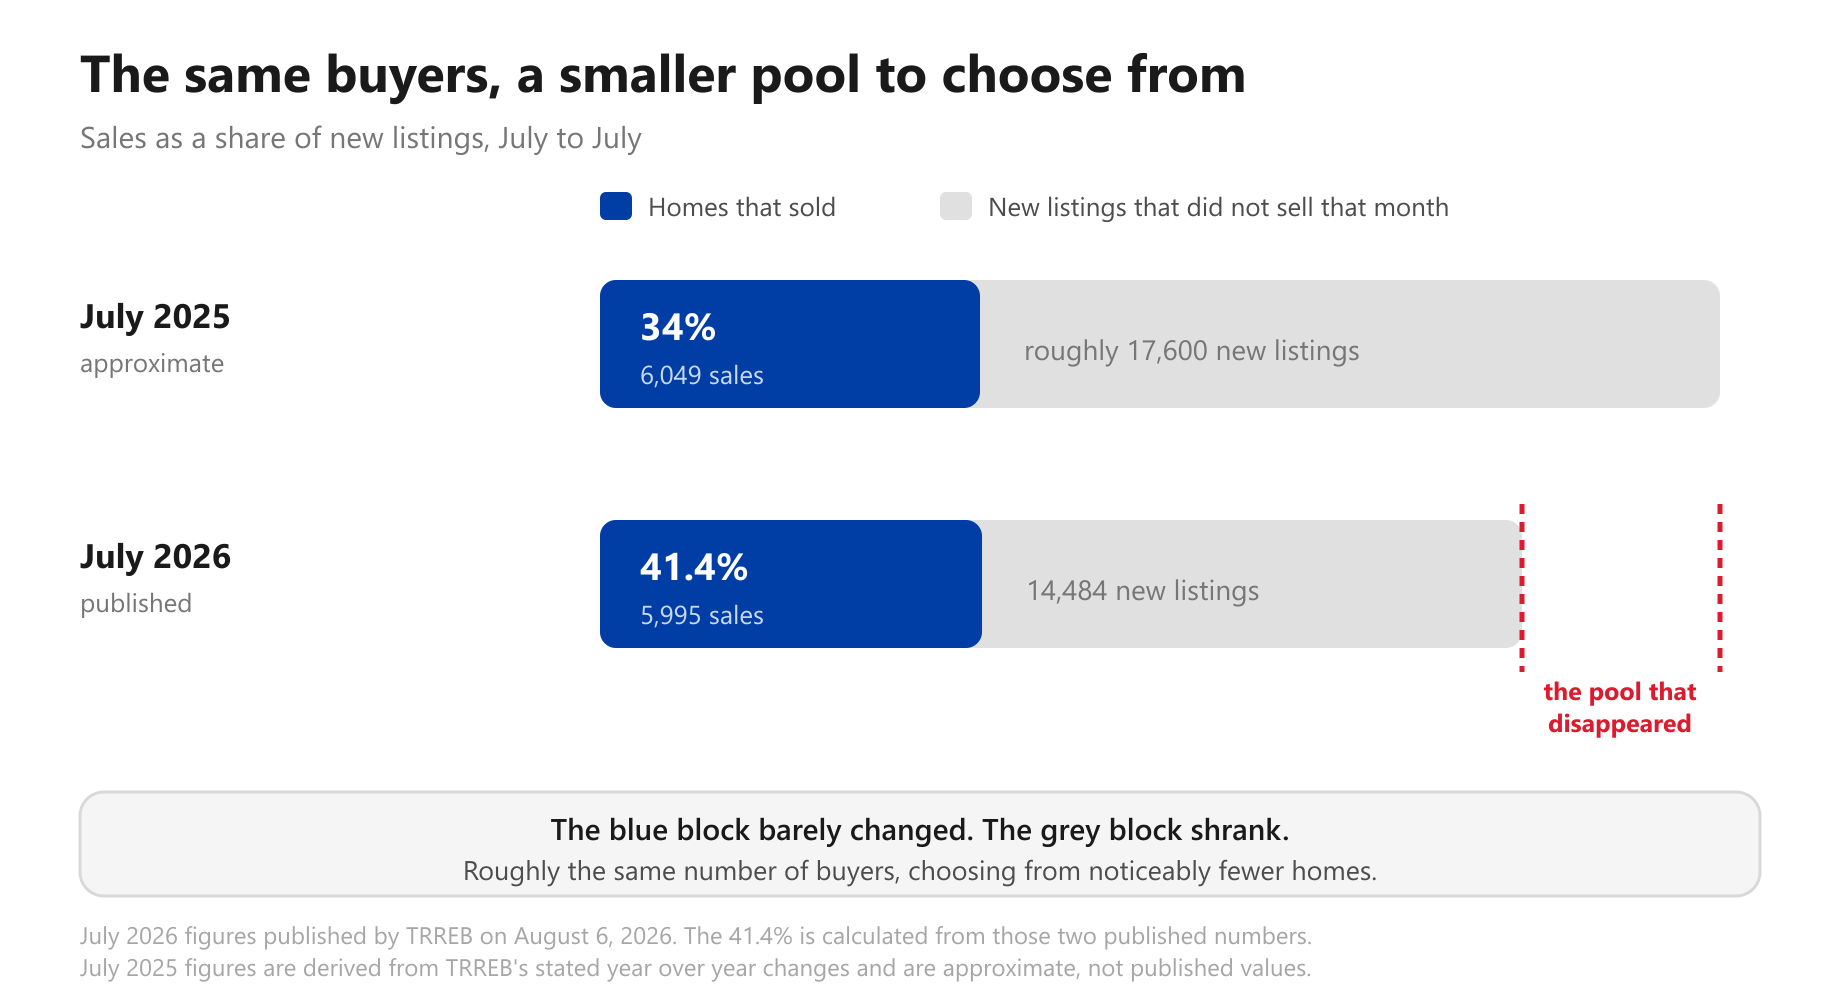
TRREB drew the same conclusion in the release itself: "With sales accounting for a larger share of listings, buyers may find there is less room to negotiate moving forward."

This is not my interpretation laid over their data. It is their read of their own numbers.

The take: a better deal requires a motivated seller. Motivated sellers are precisely the group that has been withdrawing.

If fewer homes are for sale, why are prices still falling?

Because supply is only half of a price. Demand is the other half, and demand is weak too.

The average selling price in July 2026 was $1,003,956, down 4.5 per cent from a year earlier. The MLS Home Price Index Composite, which adjusts for the mix of homes sold, was down 4.6 per cent. Both measures agree, and that agreement matters. An average price can fall simply because more inexpensive homes sold that month. When the quality adjusted index falls by the same amount, prices genuinely are lower.
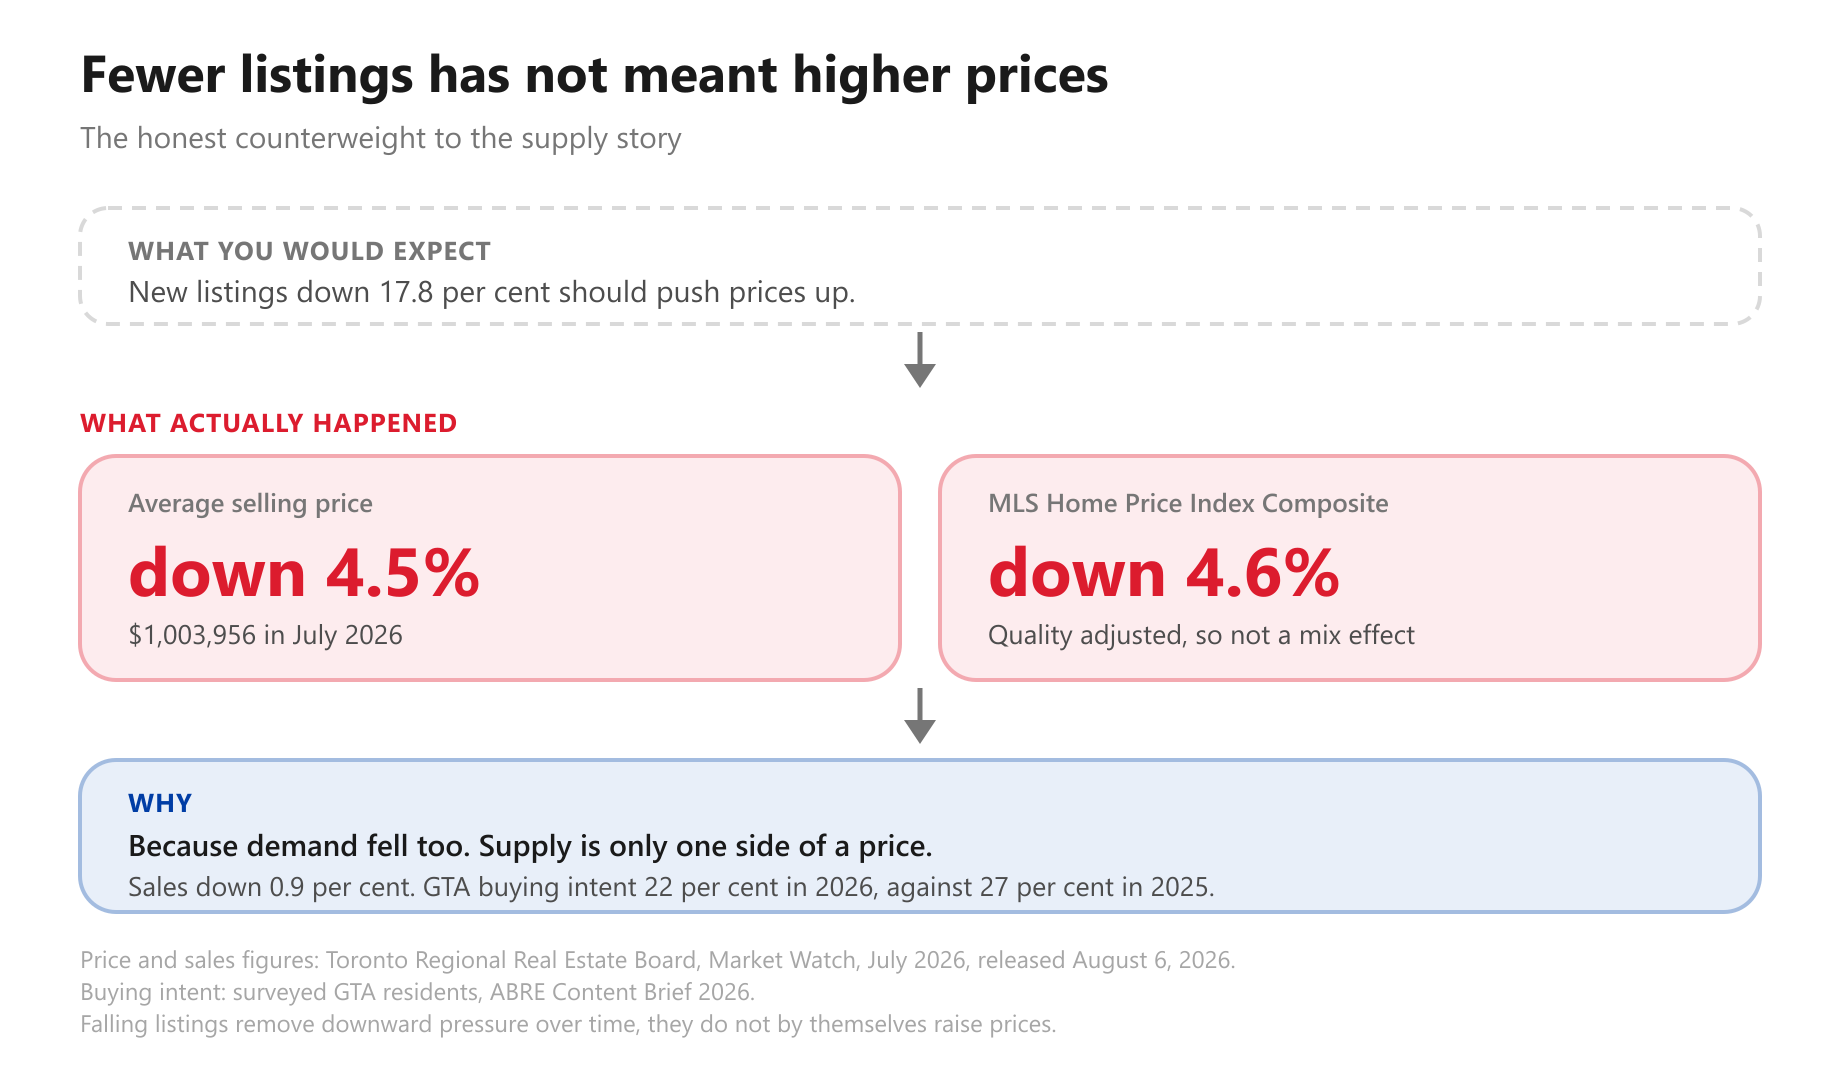
So the honest version of this argument is narrower than a headline would make it. Falling listings do not guarantee rising prices. Sales were down 0.9 per cent, and separate research puts the share of GTA residents intending to buy in 2026 at 22 per cent, down from 27 per cent in 2025. A market where both sides are stepping back can hold flat for a long time.

Anyone telling you that a 17.8 per cent drop in listings means prices are about to jump is selling you something. The data does not support it.

What the data does support is a statement about choice, not price.

What does waiting actually cost when prices are flat?

This is the part that gets missed, because the cost does not show up on a price chart.

Compare the raw counts. July 2026 brought 14,484 new listings. Applying TRREB’s stated 17.8 per cent decline, July 2025 brought roughly 17,600. That is approximately 3,100 fewer homes coming to market in a single month.
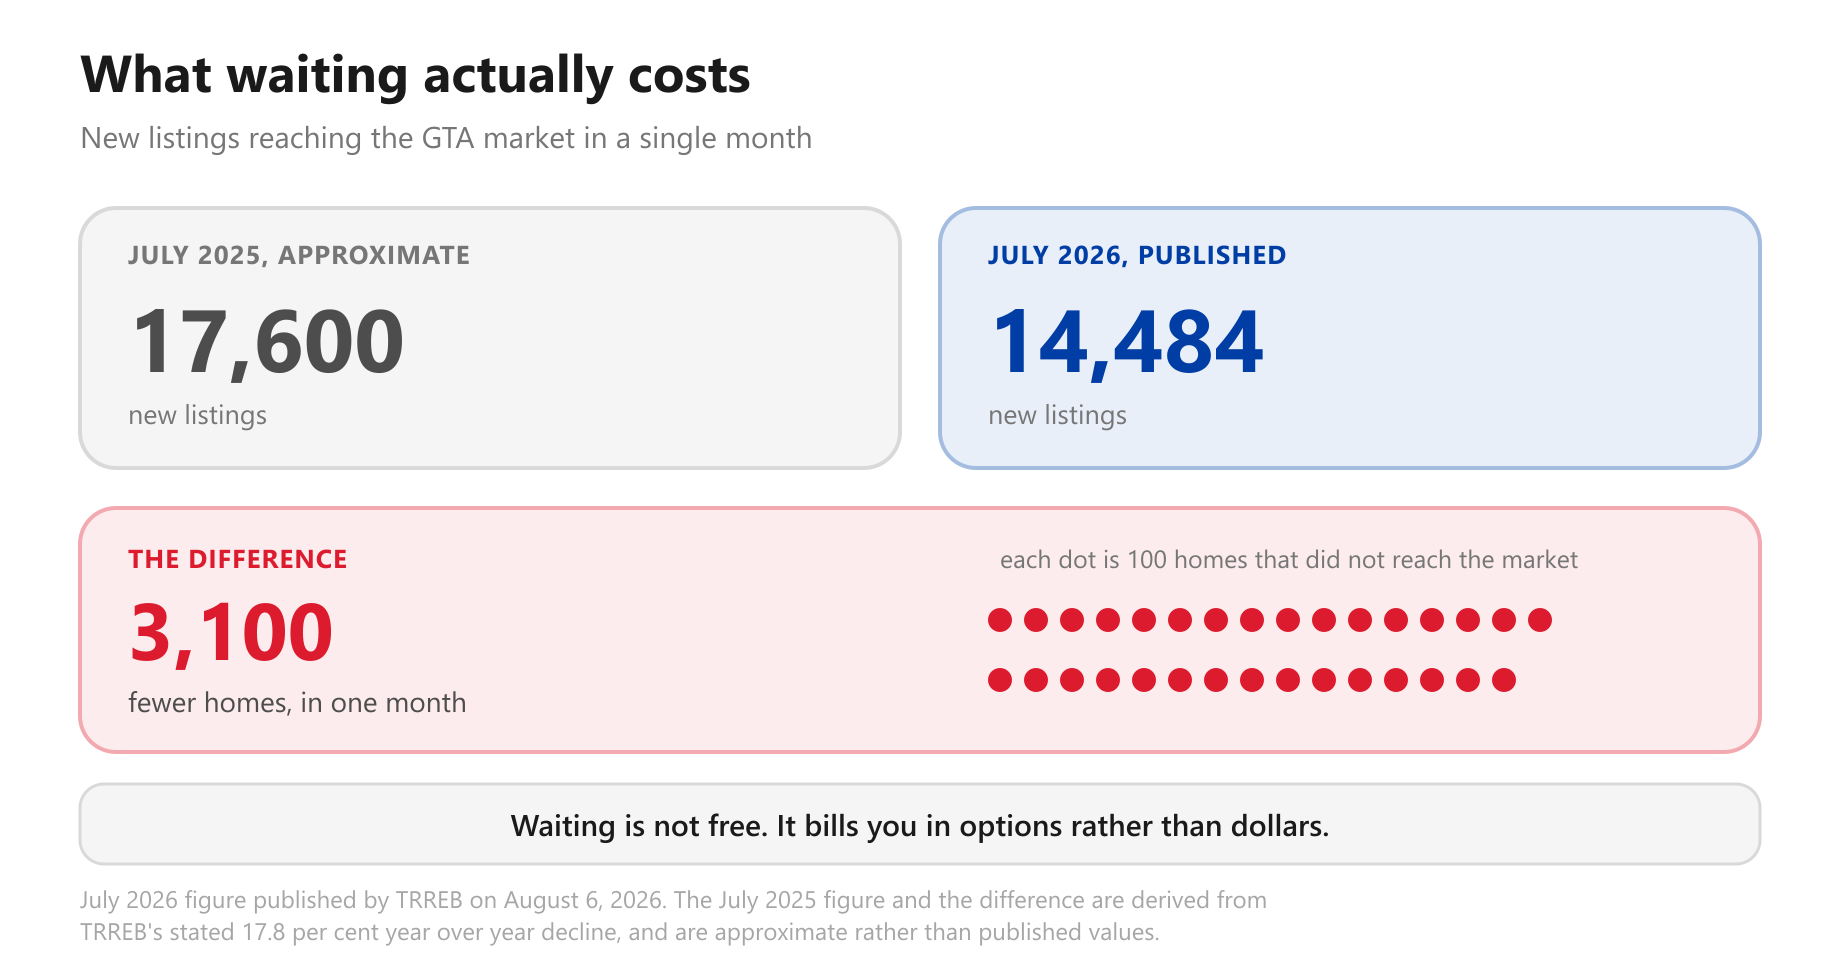
Waiting is often described as a free option. It is not free. It costs selection, and the bill arrives quietly.

Consider what that means in practice. The specific house, on the specific street, in the specific school catchment, with the layout that actually suits your family, is not a commodity. There is no guarantee of another one next spring. Fewer listings each month means fewer chances that the right one appears, and less negotiating room when it does.

If prices were falling quickly, waiting would buy you a discount that offsets the narrower selection. Prices are falling slowly, and the pace of decline has been shrinking. That trade is much less attractive than it was two years ago.

The take: waiting is a reasonable choice for many people. It is simply not a free one, and the price you pay is measured in options rather than dollars.

Does this mean I should list my home now?

It depends entirely on your situation, and I am not going to pretend otherwise.

What I can tell you is what has changed in your favour, and what has not.

What has improved for sellers: you are competing against roughly 3,100 fewer new listings a month than a seller faced a year ago. Less competition means your home is one of fewer options a serious buyer can consider.

What has not improved: prices are still down 4.5 per cent year over year, buyers remain price sensitive, and a home that is priced ambitiously will still sit. Mispriced listings get chased down with repeated reductions and frequently sell for less than comparable homes that were priced correctly on day one. Buyers negotiate harder once a listing looks stale, and staleness is visible to everyone.

Less competition is not permission to overprice. It is an argument for pricing accurately into a thinner field, which is a different and more disciplined strategy.

If you want to know what your home would realistically achieve today rather than in 2022, start with a home evaluation and look at what your neighbour sold for. Both use current comparable sales rather than a memory of the peak.

Who this changes things for

If you are buying. Your thesis for waiting was that a better deal would appear. That deal requires a motivated seller, and motivated sellers are the group leaving. This does not mean rush. It means recognise that waiting has a cost, price that cost honestly against whatever discount you expect to gain, and be genuinely ready when the right listing appears. Our home finder and the buying and selling FAQ are the practical starting points.

If you are selling. This is the least competition sellers have faced in some time, and it is happening while prices are still soft. Those two facts pull in opposite directions, so pricing strategy carries more weight than it did in either direction of the last cycle. See marketing strategy for how a listing is actually positioned.

If you are investing. Thin supply changes acquisition conditions, but it does not change the arithmetic of what a property earns against what the money costs. If your borrowing cost has moved while the Bank of Canada sat still, the mechanism is explained in Six holds in a row, so why did your fixed rate go up?

If you are selling a luxury property or an income producing property, the dynamics differ enough that they deserve their own analysis. Luxury is covered at GTALuxuryHomes.ca, and commercial, industrial and investment at The4Sale.com.

Frequently asked questions

Are sellers leaving the GTA housing market?

Yes. New listings in the Greater Toronto Area fell 17.8 per cent year over year in July 2026, to 14,484, according to the Toronto Regional Real Estate Board release of August 6, 2026. Over the same period sales fell only 0.9 per cent, to 5,995. Supply contracted sharply while demand was close to flat.

How can it be a buyer’s market when there is less to buy?

Because the two things measure different pressures. Prices are still falling, at 4.5 per cent below last July, which favours buyers on price. But new listings fell 17.8 per cent while sales fell only 0.9 per cent, so sales now absorb 41.4 per cent of new listings rather than roughly 34 per cent a year ago. Buyers keep the price advantage and lose the selection advantage at the same time.

If fewer people are selling, why are prices still falling?

Because demand fell too. Supply is only one side of a price. Sales were down 0.9 per cent year over year in July 2026, and surveyed buying intent among GTA residents dropped from 27 per cent in 2025 to 22 per cent in 2026. When both sides step back together, reduced listings do not automatically lift prices. The average price fell 4.5 per cent and the quality adjusted MLS Home Price Index Composite fell 4.6 per cent.

Does a drop in new listings mean prices will go up?

Not on its own. In July 2026 GTA new listings fell 17.8 per cent year over year while the average selling price still fell 4.5 per cent and the MLS Home Price Index Composite fell 4.6 per cent. Tightening supply removes downward pressure over time, but prices only rise when demand holds or grows, and GTA sales were slightly lower year over year.

What is the cost of waiting to buy if prices are flat?

The cost is selection rather than money. July 2026 brought 14,484 new GTA listings. Applying TRREB’s reported 17.8 per cent decline, July 2025 brought roughly 17,600, so about 3,100 fewer homes reached the market in a single month. A buyer waiting for a better price is choosing from a visibly smaller pool each month while the price decline itself is slowing.

When is the next GTA market update published?

The Toronto Regional Real Estate Board publishes Market Watch monthly, generally in the first week of the following month. July 2026 data was released on August 6, 2026, and August 2026 data is expected in early September 2026. The Bank of Canada’s next scheduled interest rate announcement is September 2, 2026.

What I would do next

If you are thinking about selling, find out what your home is actually worth in this market before you decide anything. If you are thinking about buying, be ready, because the pool you are choosing from is getting smaller each month even while prices drift.

Thinking about buying, selling, or investing in the GTA? The Ali Bolourchi Real Estate (ABRE) Team delivers a premium, concierge level process from first conversation to closing. Let's talk about what this market means for your timeline and your numbers.

☎ CALL US: 416-886-2000
🌐 Visit: www.ali.realtor

This article is general market information, not financial, legal or tax advice. Market figures change monthly and the figures above reflect the July 2026 Toronto Regional Real Estate Board release. Confirm your own position with a licensed mortgage professional, your lawyer and your accountant before acting.

Sources

Toronto Regional Real Estate Board, Market Watch, July 2026, released August 6, 2026. Sales 5,995 (down 0.9 per cent), new listings 14,484 (down 17.8 per cent), average selling price $1,003,956 (down 4.5 per cent), MLS Home Price Index Composite down 4.6 per cent.
Toronto Regional Real Estate Board, Market Watch archive, confirmed August 23, 2026: July 2026 is the most recent published month.
Bank of Canada, upcoming events schedule, confirmed August 23, 2026: next interest rate announcement September 2, 2026.
Surveyed GTA buying intent, 22 per cent in 2026 against 27 per cent in 2025.
The sales to new listings ratio for July 2026 is calculated from the two published TRREB figures. The July 2025 comparison is derived from TRREB’s stated year over year percentage changes and is therefore approximate.

Ali Bolourchi, BSc, MS, PSA, ABR®, Broker of A.B.R.E. Team with REMAX® Your Community Realty Inc

Read

Six holds in a row. So why did your fixed rate go up?

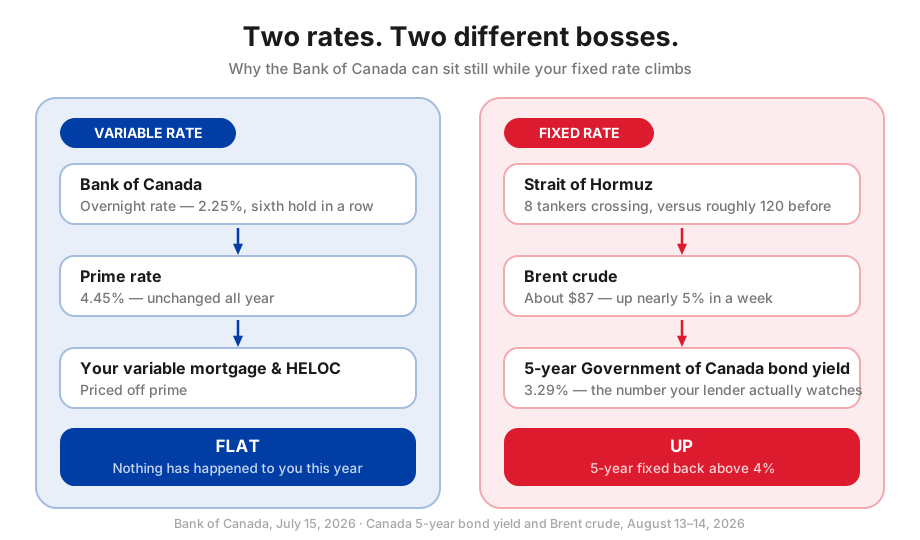
The Bank of Canada has held its overnight rate at 2.25% six times in a row, most recently on July 15, 2026. Yet five-year fixed mortgage rates are back above 4%. Those two facts are not a contradiction. Fixed rates follow the bond market, not the Bank — and the bond market is pricing a war.

The five-year Government of Canada bond yield closed at 3.29% on August 14, 2026, and the best available five-year fixed mortgage rates now sit between 3.94% and 4.09%. The Bank of Canada did not move any of that. A tanker route on the other side of the world did.

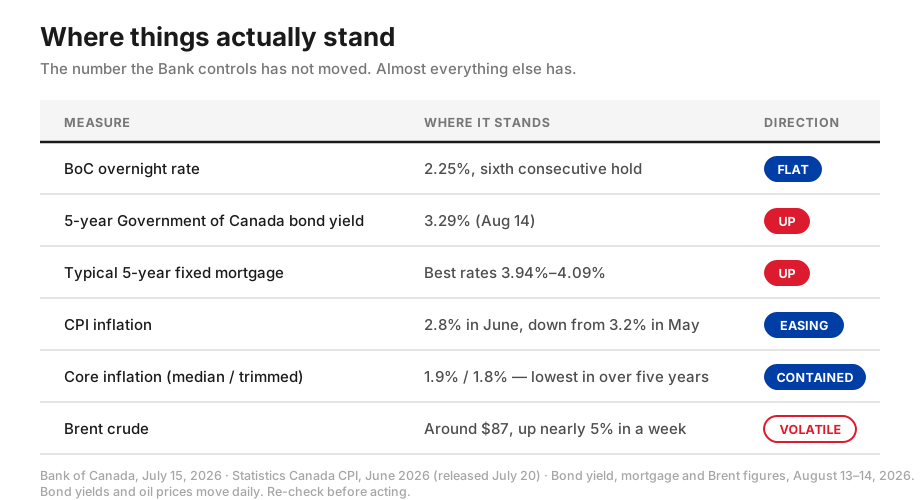
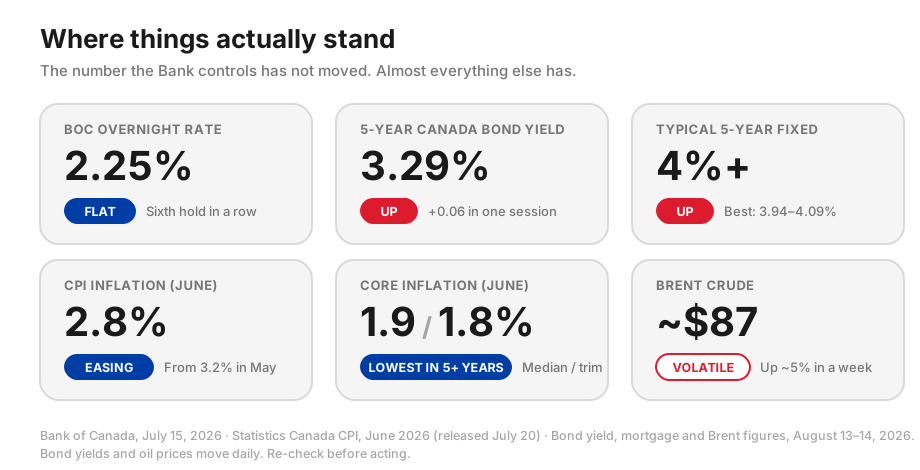
Where things actually stand

Read that table top to bottom and the story tells itself. The number the Bank controls has not moved. Almost everything else has.

Why did my fixed rate go up if the Bank of Canada did nothing?

Because they are two different rates driven by two different things.

The overnight rate sets what banks charge each other for overnight money. It flows through to prime — currently 4.45% — which is what your variable-rate mortgage and your line of credit are priced from. That rate is sitting still, and has been for six meetings.

Five-year fixed mortgages are priced off the five-year Government of Canada bond yield. Lenders borrow at roughly that yield and lend to you at a spread above it. When the bond yield rises, fixed mortgage rates follow within days, and the Bank of Canada does not get a vote.

That yield climbed to 3.29% on August 14, up six basis points in a single session. So fixed rates moved. The Bank did not.

The take: if you hold a variable mortgage, nothing has happened to you this year. If you are shopping for a fixed rate, quite a lot has.

Is the war actually pushing Canadian rates up?

Yes — but indirectly, and almost entirely through oil.

The Bank was blunt about it in July: global economic prospects “have been dented by higher oil prices stemming from the Middle East conflict.” Canadian inflation hit 3.2% in May, and the Bank attributed that mainly to higher gasoline prices linked to the conflict.

June brought relief. Inflation eased to 2.8%, almost entirely because gasoline fell in the month after an interim ceasefire cooled crude. Gasoline was still up 20.5% from a year earlier, but that was far better than May’s 33.2%.

That relief did not last. Brent fell as low as $69 on July 2 after a US–Iran memorandum, then spiked to $105 on July 23 following attacks on tankers in the Strait of Hormuz. It sits near $87 today, having gained nearly 5% in a week as Iran stated the Strait will not reopen until its conditions are met.

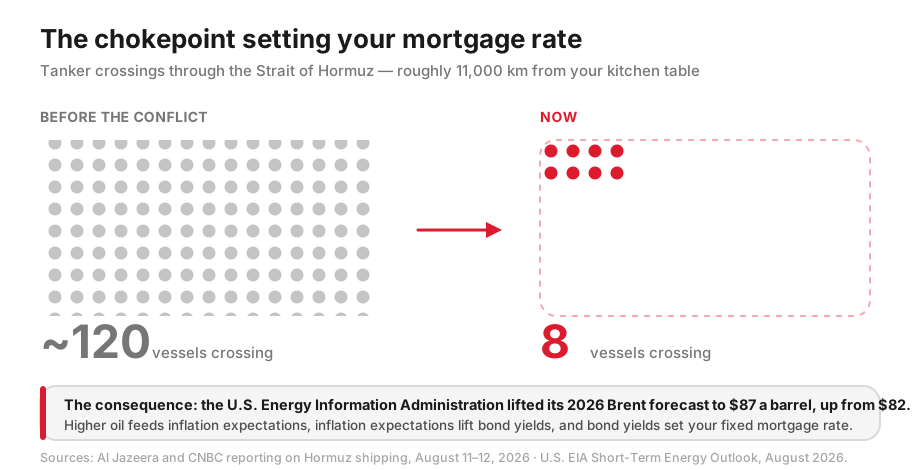
The physical picture is the part most coverage skips. Roughly eight vessels are now crossing the Strait, against about 120 before the conflict. The U.S. Energy Information Administration responded by lifting its 2026 Brent forecast to $87 a barrel, up from $82.

So the pressure is real. It is also imported. This is not Canadian wage growth or domestic demand overheating. It is a shipping lane two oceans away — and that distinction matters enormously for what happens next.

What would actually make the Bank of Canada raise rates?

Central banks generally look through an oil shock. A one-time jump in fuel prices raises the price level but does not, by itself, create sustained inflation. Raising rates to fight it would slow an already soft economy without touching the cause.

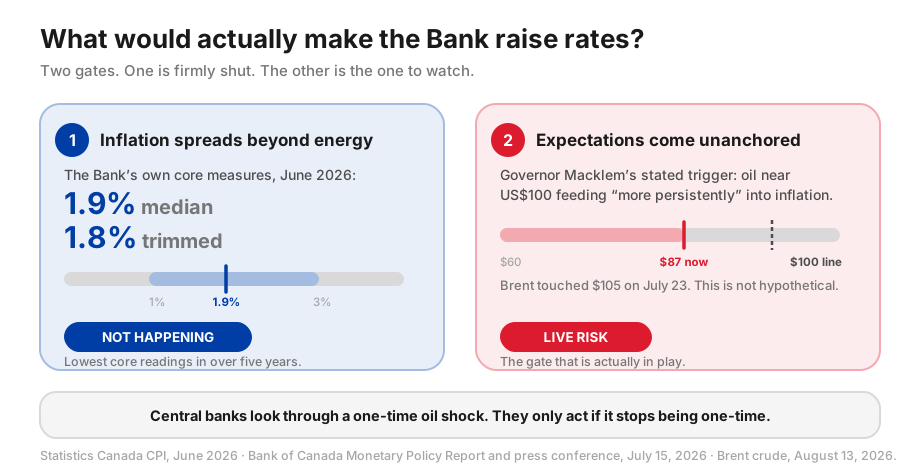
The Bank only has to act if the shock stops being one-time. Two things would signal that.

The first is inflation spreading beyond energy. Right now it has not — and this is the single most reassuring number in the whole picture. The Bank’s own preferred core measures both fell in June: median core to 1.9% and trimmed-mean core to 1.8%, their lowest readings in over five years. Headline inflation is being pushed around by gasoline. Underneath it, price pressure is not just contained, it is easing.

The second is expectations coming unanchored. If households and businesses start planning for permanently higher prices, that behaviour becomes self-fulfilling. Governor Macklem has said that if oil reached roughly US$100 a barrel and fed “more persistently” into inflation, hikes could become necessary.

Brent touched $105 in July. So this is not a hypothetical — it is a live scenario. But the Bank still projects inflation returning to around 2% in early 2027.

The take: gate one is firmly shut, and moving further shut. Gate two is the one worth watching — and it is watched most cheaply by watching the price of oil.

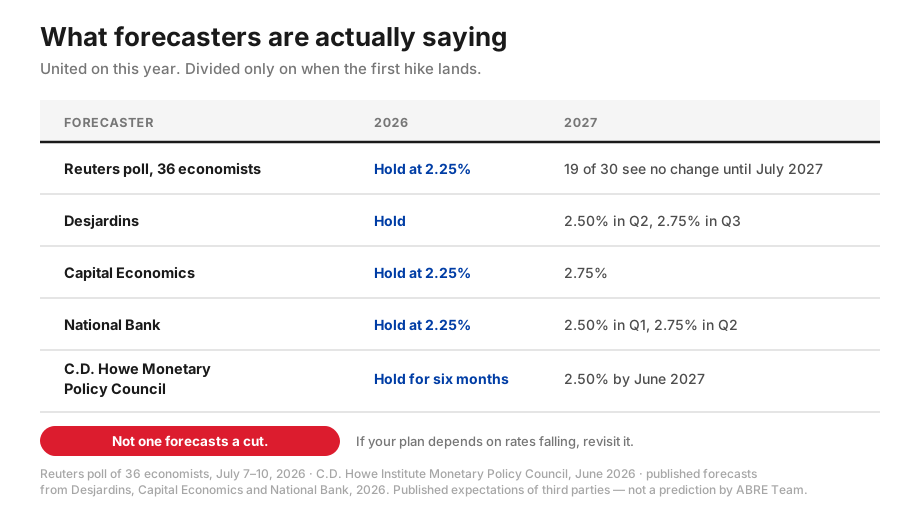
What are economists actually forecasting?

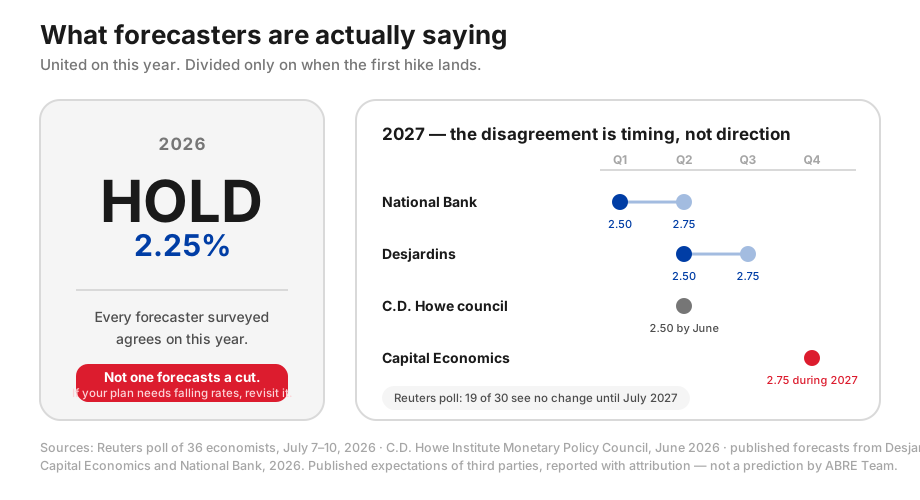
The consensus is remarkably united on the near term and divided only on the timing of the eventual move.

Every one of them says the same thing about this year: no change. Where they differ is whether the first hike lands early or late in 2027, and whether it stops at 2.50% or continues to 2.75%.

Worth noting that not one of them forecasts a cut. If your plan depends on rates falling to rescue affordability, that plan needs revisiting.

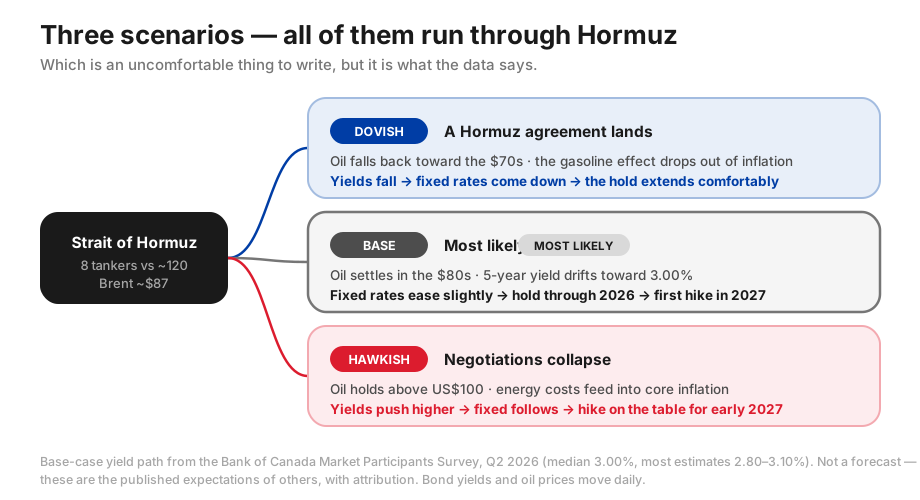
Three scenarios worth holding in mind

Base case, and the most likely. The overnight rate stays at 2.25% through 2026. Oil settles somewhere in the $80s. The five-year bond yield drifts toward 3.00% — the median expectation in the Bank’s own Market Participants Survey, with most estimates between 2.80% and 3.10%. Fixed rates ease slightly. The first hike arrives in 2027.

The hawkish case. Hormuz negotiations collapse, oil holds above US$100, and higher energy costs work through into core inflation and expectations. Bond yields push higher, fixed rates follow, and a hike moves onto the table for early 2027. This is the scenario Macklem described, not one I am inventing.

The dovish case. A Hormuz agreement lands, oil falls back toward the $70s, and the gasoline effect drops out of the inflation numbers. Yields fall, fixed rates come down, and the hold extends comfortably.

Notice that all three run through the Strait of Hormuz. That is genuinely where Canadian fixed mortgage rates are being decided right now. It is an uncomfortable thing to write, but it is what the data says.

What should I do about fixed versus variable?

I am not going to tell you which to take. That depends on your income stability, how long you plan to stay, and how you sleep. But the trade-off is unusually clear at the moment.

Variable is priced off a rate that has not moved in six meetings and that nobody surveyed expects to move this year. The risk is 2027, and the risk is upward.

Fixed has already absorbed the war premium. You are paying above 4% today partly for a conflict that may resolve. If it does, you will have locked in at a worse rate than someone who waited. If it does not, you will be glad you locked.

What I would avoid is the middle path of waiting for clarity. There is no announcement coming that makes this obvious. The July CPI release on August 17 and the Bank’s next decision on September 2 will move the numbers, but neither will settle the Hormuz question.

Who this changes things for

If you are buying now. Get your rate hold in writing and know exactly how long it lasts. Rate holds typically run 90 to 120 days, and in a market where fixed rates move within days of the bond yield, that hold has real value. Qualify at the stress test rate, not at the rate you hope to get.

If you are renewing. You are not stuck with your current lender. Straight switches — same balance, same amortization, same property — do not require you to requalify under the stress test. Shop it. If you add to the balance in the same step you lose that exemption, so handle any extra borrowing separately.

If you are selling. Your buyer’s budget is being set by the bond market, not by the Bank of Canada’s headline. Every 25 basis points on a five-year fixed reduces what a qualified buyer can carry. Price against the market that exists, not the one from the last rate announcement you read about.

If you are investing. With the five-year yield above 3% and commercial borrowing costs above that, the gap between your borrowing cost and your cap rate is the number to watch. When borrowing costs exceed the cap rate, additional leverage lowers your return rather than raising it.

Frequently asked questions

Is the Bank of Canada going to raise rates in September?

Almost certainly not. All 36 economists in a July Reuters poll expected a hold, and the Bank itself called the current policy rate appropriate on July 15, 2026. The next scheduled decision is September 2, 2026. The realistic debate is about 2027, not this autumn.

Why is my variable rate unchanged while fixed rates rose?

Variable rates follow prime, which follows the Bank of Canada’s overnight rate. That has been at 2.25% for six consecutive decisions, leaving prime at 4.45%. Fixed rates follow the five-year Government of Canada bond yield, which rose to 3.29% on August 14, 2026 on war and inflation risk. Different anchors, different outcomes.

Will fixed mortgage rates come back down?

They could. The Bank of Canada’s Market Participants Survey for the second quarter of 2026 shows a median expectation of 3.00% for the five-year yield by year end — below the 3.29% where it sits now — with most estimates between 2.80% and 3.10%. That points to modest relief, and it assumes the Middle East situation does not deteriorate further.

Does a war automatically mean higher interest rates?

No. Central banks usually look through energy shocks, because a one-time price jump is not sustained inflation. Rates only rise if the shock spreads into core inflation or unanchors expectations. Canada’s core inflation measures actually fell in June 2026, to 1.9% median and 1.8% trimmed — their lowest in over five years — which suggests it has not spread.

What is the single number to watch?

The price of Brent crude. Governor Macklem has indicated that oil near US$100 a barrel, feeding persistently into inflation, could make hikes necessary. Brent touched $105 on July 23, 2026 and sits near $87 in mid-August. Everything else follows from there.

How does the Strait of Hormuz affect a mortgage in Toronto?

Through four steps. Restricted tanker traffic through the Strait — roughly eight vessels crossing versus about 120 before the conflict — pushes oil prices up. Higher oil lifts inflation and inflation expectations. Those expectations push government bond yields higher. Canadian five-year fixed mortgage rates are priced off the five-year Government of Canada bond yield, so they rise within days.

What I would do next

If your mortgage renews within the next twelve months, start the conversation now rather than waiting for the letter. If you are buying, get the rate hold and understand its expiry date.

Then look at what is actually affordable at today’s rates, rather than at the rate you were quoted six months ago.

Take the affordability quiz — see which programs you qualify for, in about 90 seconds.
Or email [email protected] and I will look at your specific numbers.

Not financial, mortgage or tax advice. Rate levels, bond yields and oil prices move daily; the figures above reflect August 13–14, 2026 and should be re-checked before you act. Confirm details with a licensed mortgage professional.

Sources


Ali Bolourchi, BSc, MS, PSA, ABR®, Broker
ABRE Team — REMAX® Your Community Realty, Brokerage

8854 Yonge St, Richmond Hill, ON L4C 0T4 · [email protected]

Read

Lawrence Park VS Forest Hill
Toronto midtown · July 2026 market data · Ali Bolourchi

Two of Toronto's most established addresses, eight kilometres apart, behaving like two different markets. Forest Hill costs more and moves slower. Lawrence Park costs less and clears faster. If you are buying one of them as an investment, that difference matters more than the price gap.

The short answer

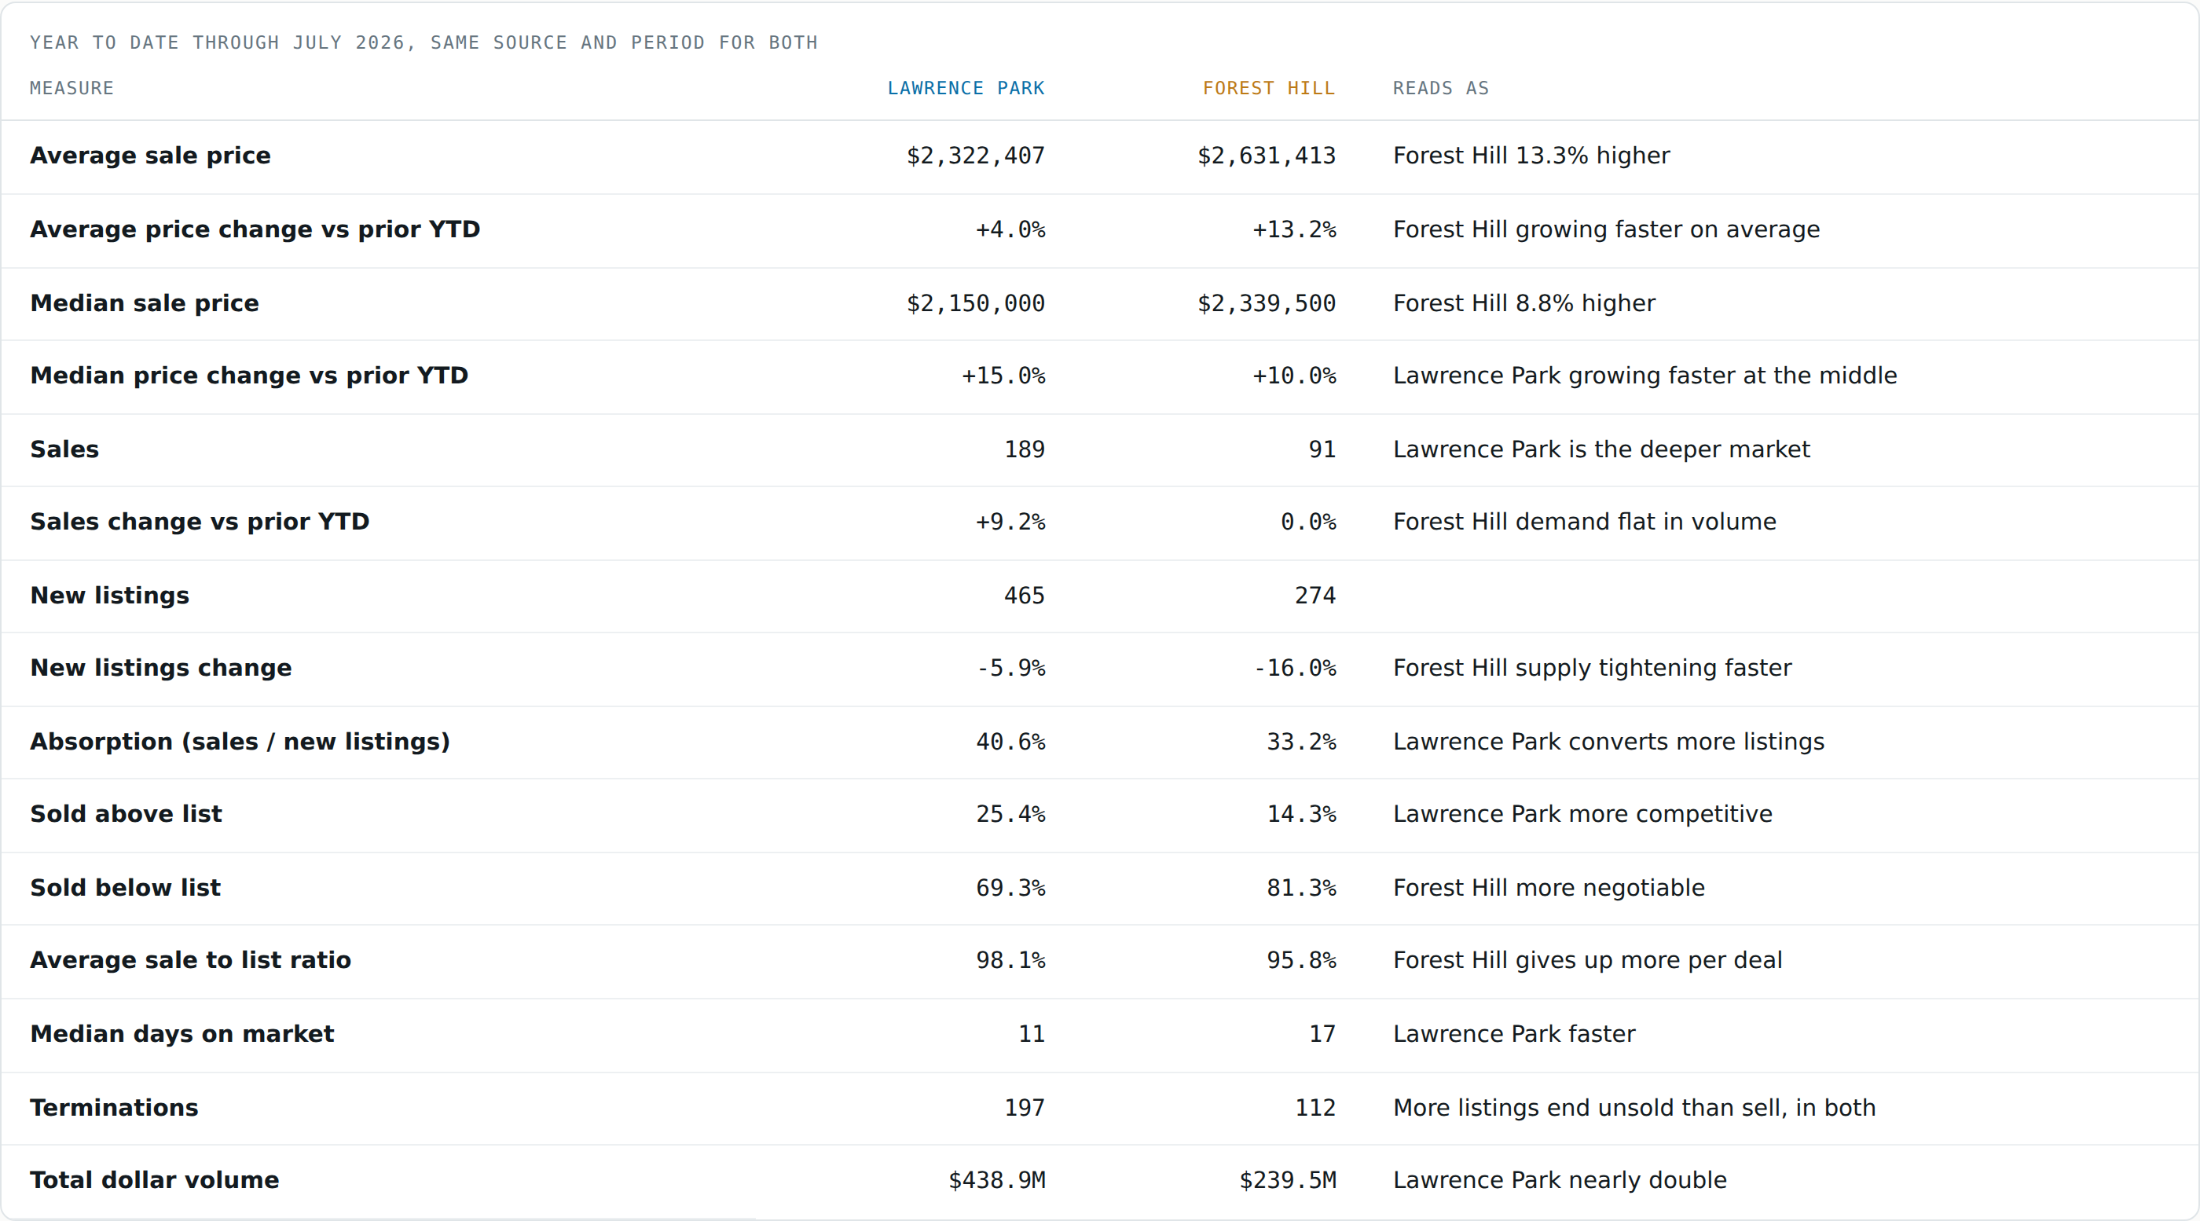
On the year to date numbers, Lawrence Park is the stronger investment case for most buyers, and it wins on liquidity rather than on price growth. Homes there sell in a median of 11 days at 98.1% of asking, and one sale in four goes above list. Forest Hill sells in a median of 17 days at 95.8% of asking, with one in seven above list. Forest Hill is the better market to negotiate in. Lawrence Park is the better market to get out of.

Lawrence Park North & South (Toronto C04)Forest Hill North & South (Toronto C03, C04)

Source: MLS market report, all property types, year to date through July 2026, same period and same source for both areas. Sale prices, not list prices.

Why liquidity is the whole argument

Both neighbourhoods will hold their value. Neither is going out of style. The measurable difference is how reliably you can turn one back into cash, and on every liquidity measure Lawrence Park is ahead.

WHAT HAPPENS TO 100 LISTINGS

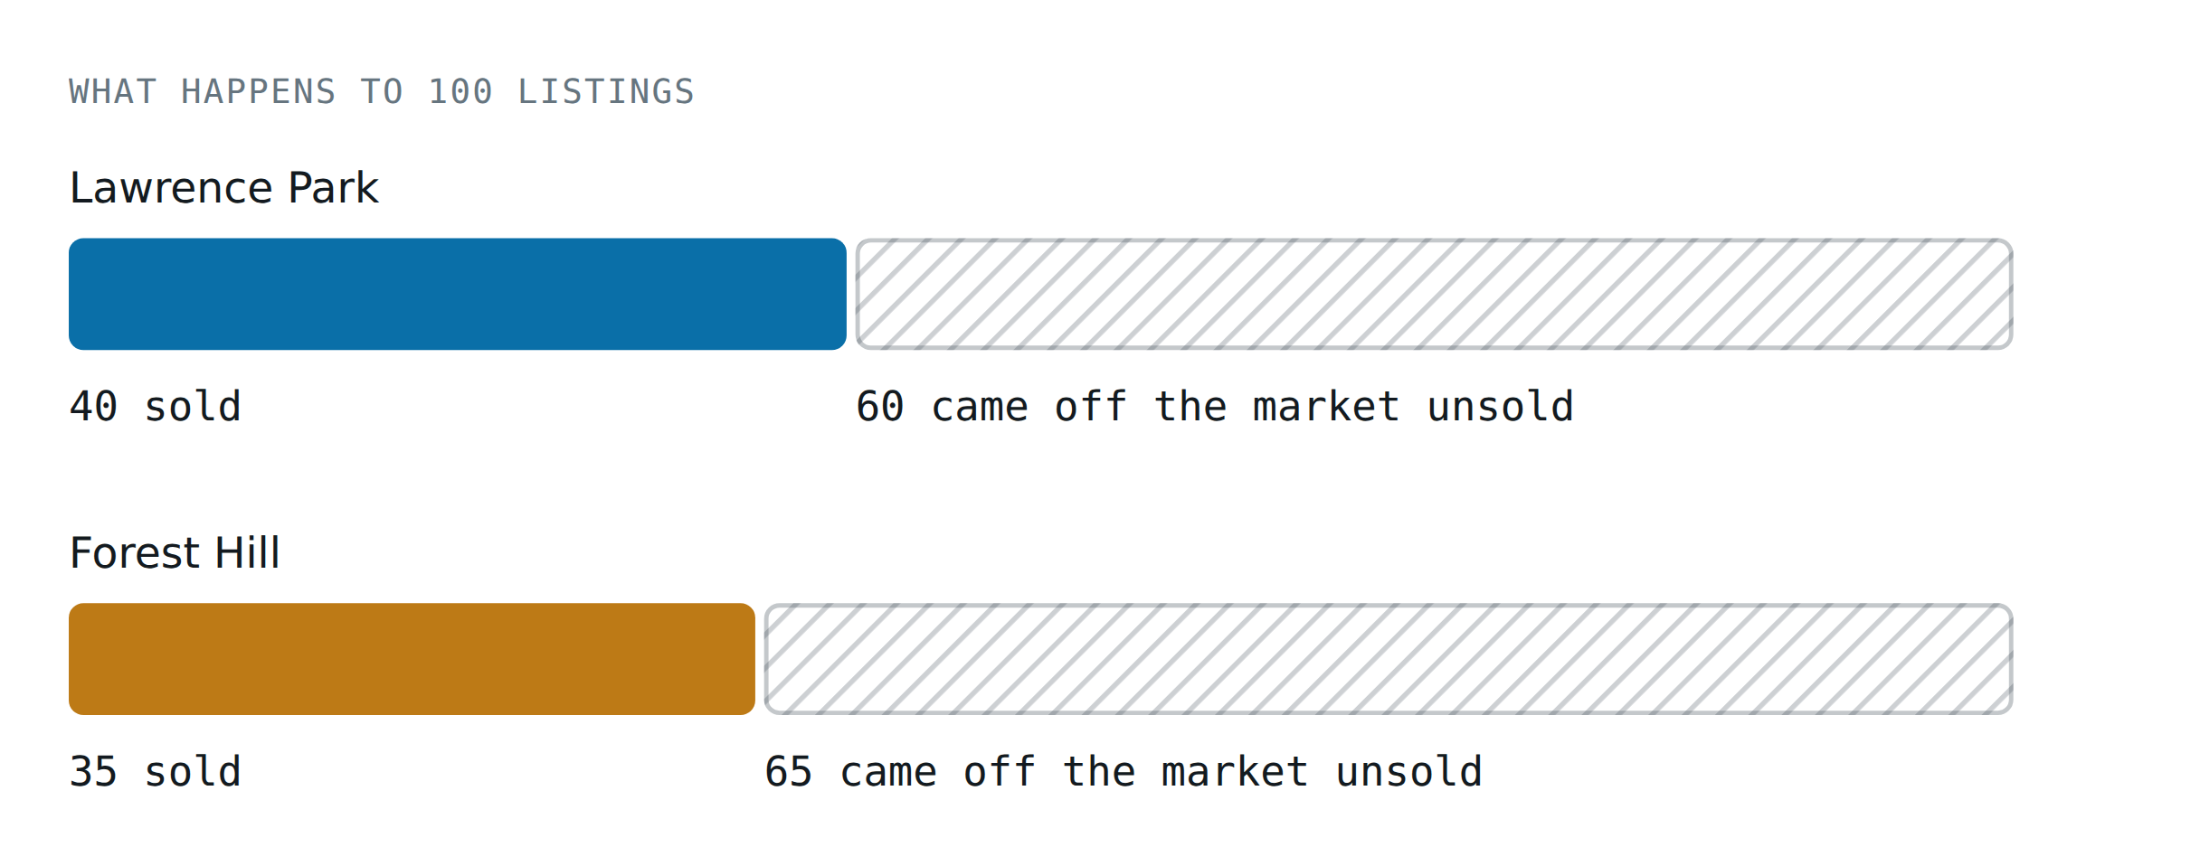
Solid is sold, hatched is withdrawn or expired. Averaged across every monthly listing cohort from March 2025 to February 2026. Cohorts after that are excluded because those listings have not had time to resolve. Calculated independently, year to date sales as a share of new listings land in the same place: 40.6% and 33.2%.

That is the number most people have never seen, and it is the one I would want if I were buying. In both neighbourhoods, most listings never sell. The year to date terminations confirm it: Lawrence Park recorded 197 terminations against 189 sales, Forest Hill 112 against 91. In Forest Hill, for roughly every four homes that sold, five came off the market unsold.

MEDIAN TIME TO SELL, YEAR TO DATE

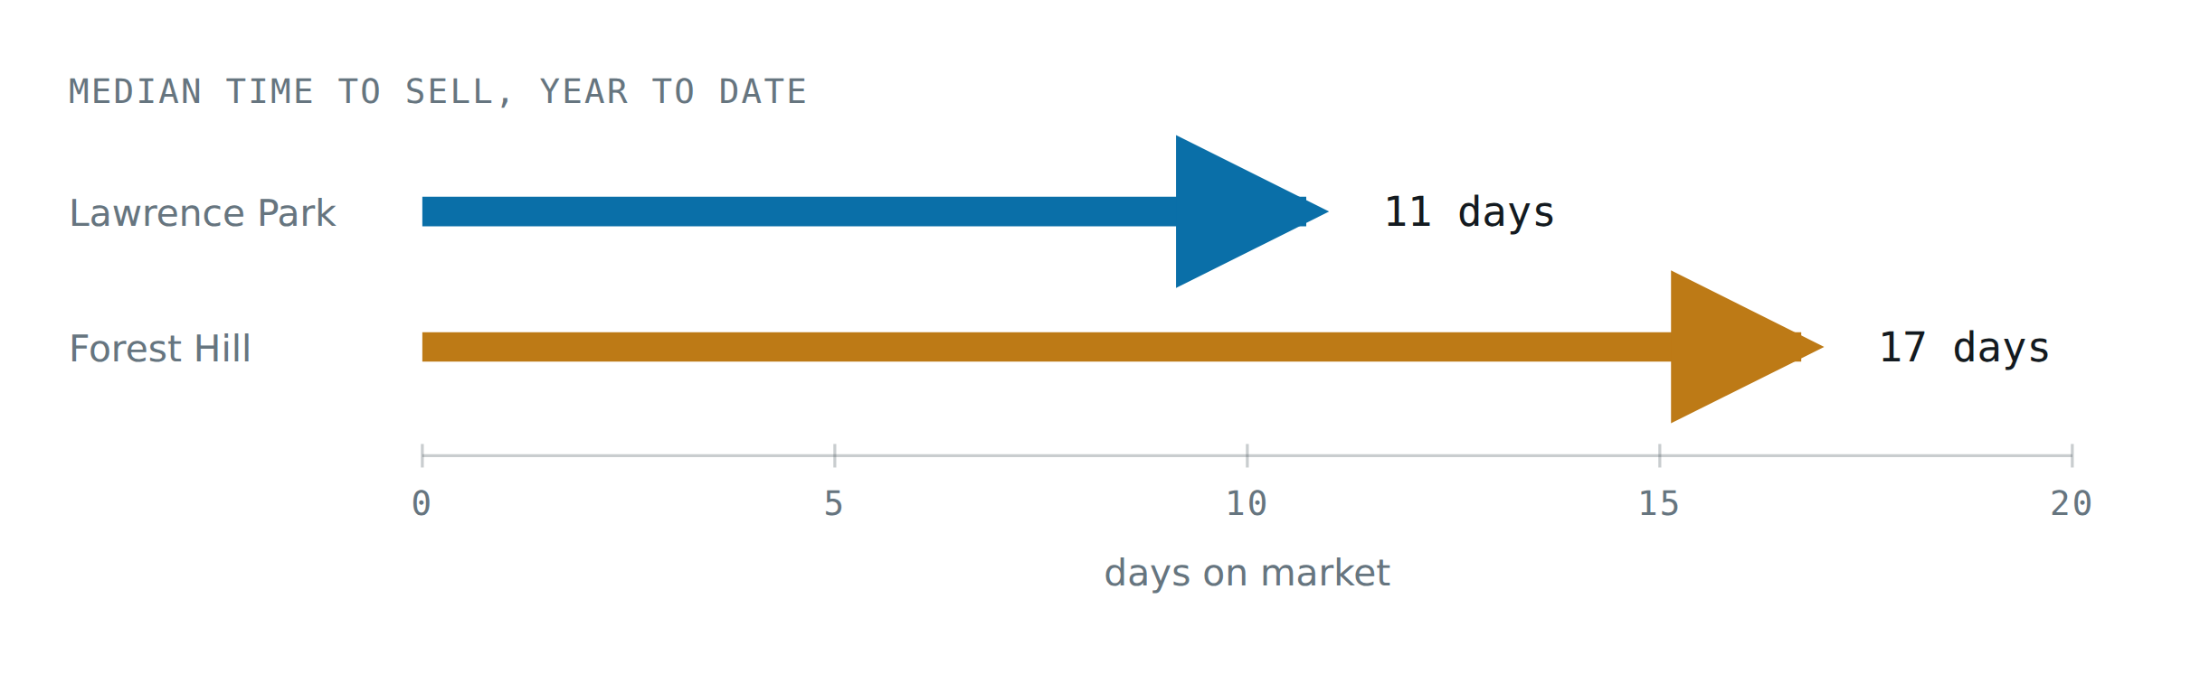
Six days of difference at the median, and the gap widens at the average: 23 days against 30. Lawrence Park also holds more of its asking price, 98.1% against 95.8%, and sells above list in a quarter of cases against one in seven.

One number in this data will mislead you

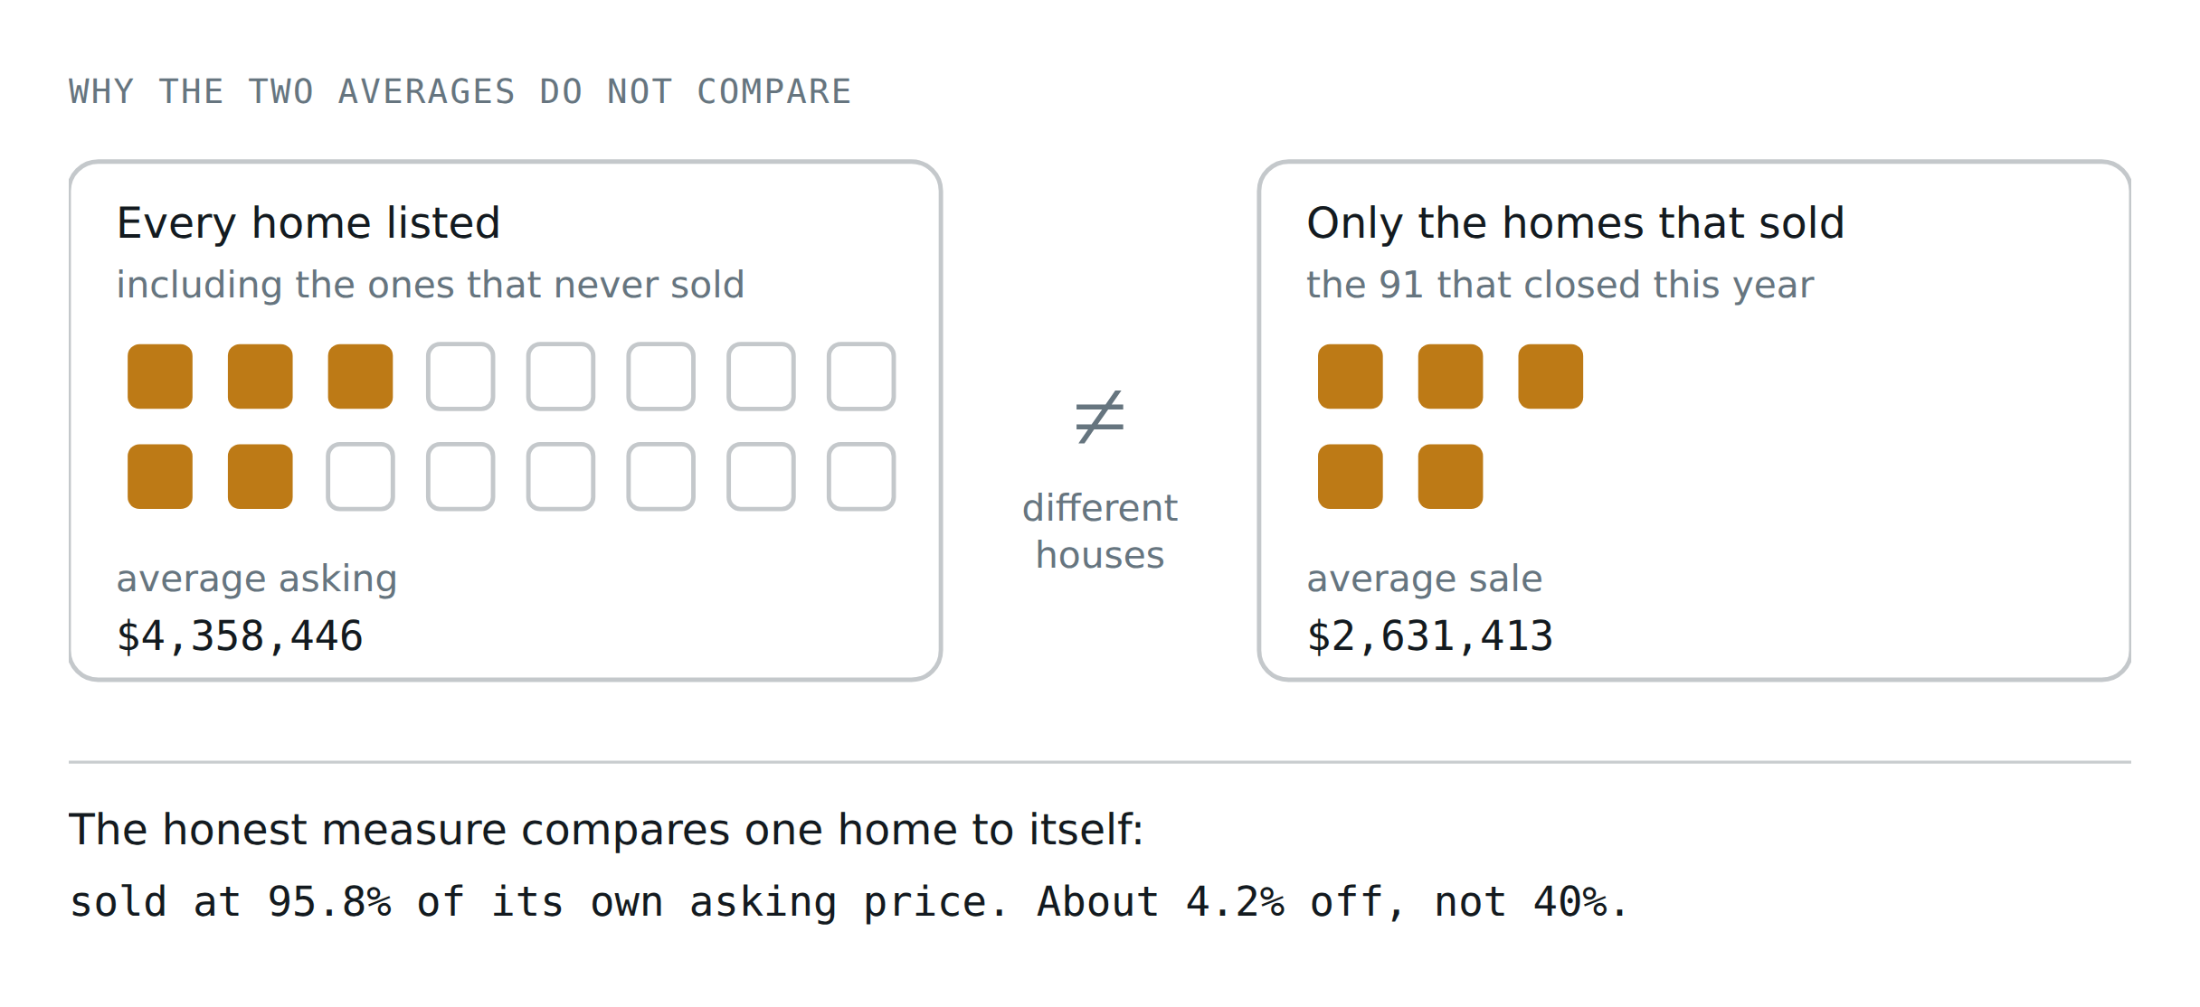
Forest Hill's average list price year to date is $4,358,446. Its average sale price is $2,631,413. That looks like sellers are accepting 40% below asking. They are not. Those two figures are averages of two different groups of houses.

WHY THE TWO AVERAGES DO NOT COMPARE

The honest measure compares one home to itself:sold at 95.8% of its own asking price. About 4.2% off, not 40%.

The list price average is dragged upward by expensive listings that never found a buyer. The sale price average only ever contains homes that did. What the wide gap really tells you is that Forest Hill's priciest listings are sitting, which is useful, but it is a different fact from how hard sellers are negotiating.

The full comparison

All figures MLS market report, year to date through July 2026, all property types, all architectural styles, all bed and bath counts. Lawrence Park North and South (Toronto C04). Forest Hill North and South (Toronto C03 and C04). Absorption and dollar volume rounding calculated from the same report.

What the July figures are not telling you

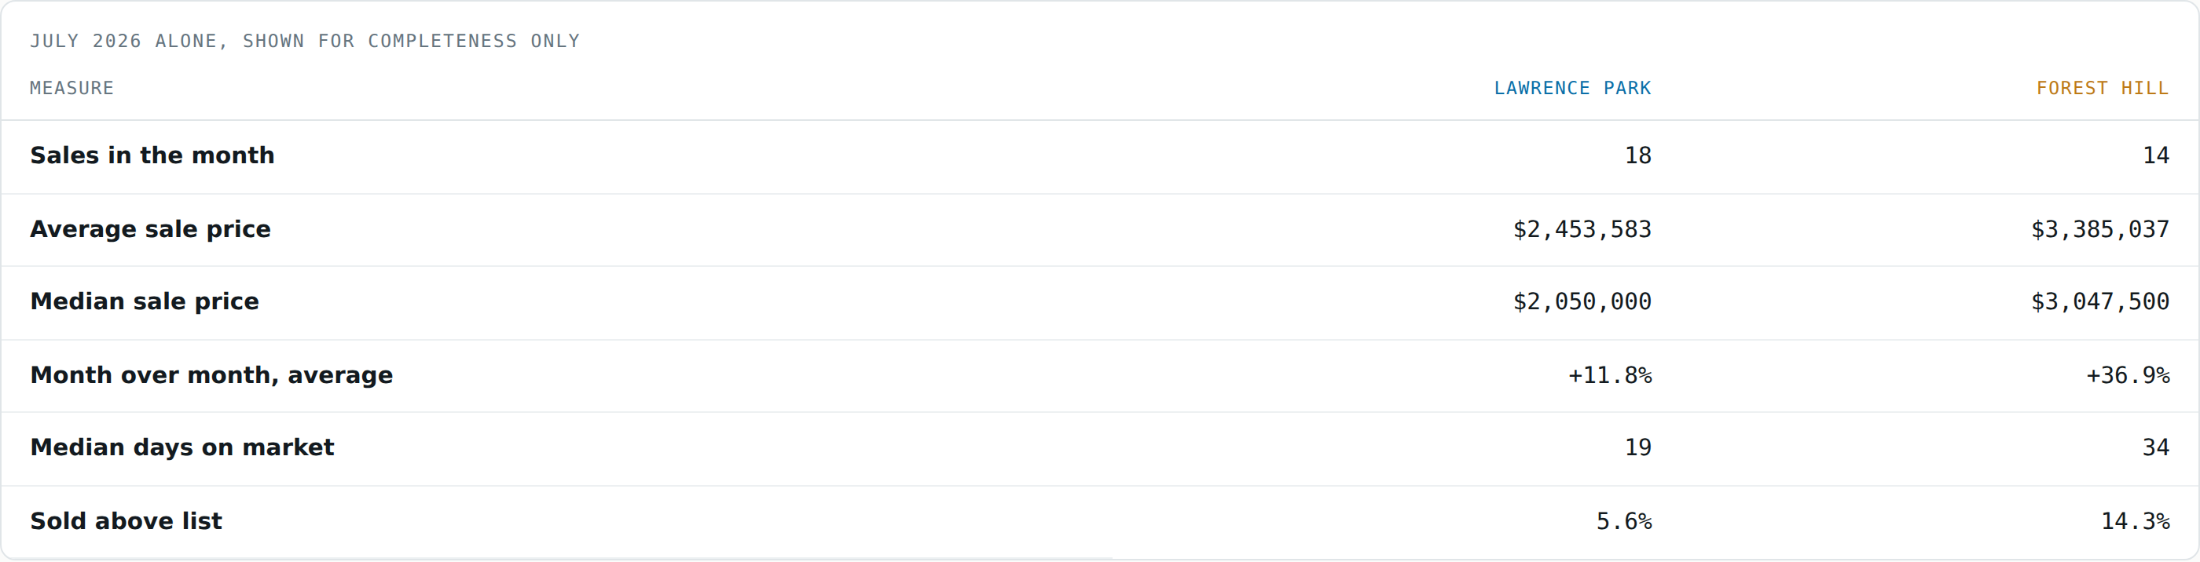
July 2026 alone shows Forest Hill's average price up 36.9% month over month and its median up 47.8%. Those are not real moves. They rest on 14 sales. Lawrence Park's month rests on 18. At that sample size, two large houses closing in the same month move the average more than the market does.

This is why everything above is year to date. 91 and 189 sales are enough to say something. 14 and 18 are not, and any report that leads with a monthly swing on a single neighbourhood is selling you volatility as insight.

Schools, shops and transit

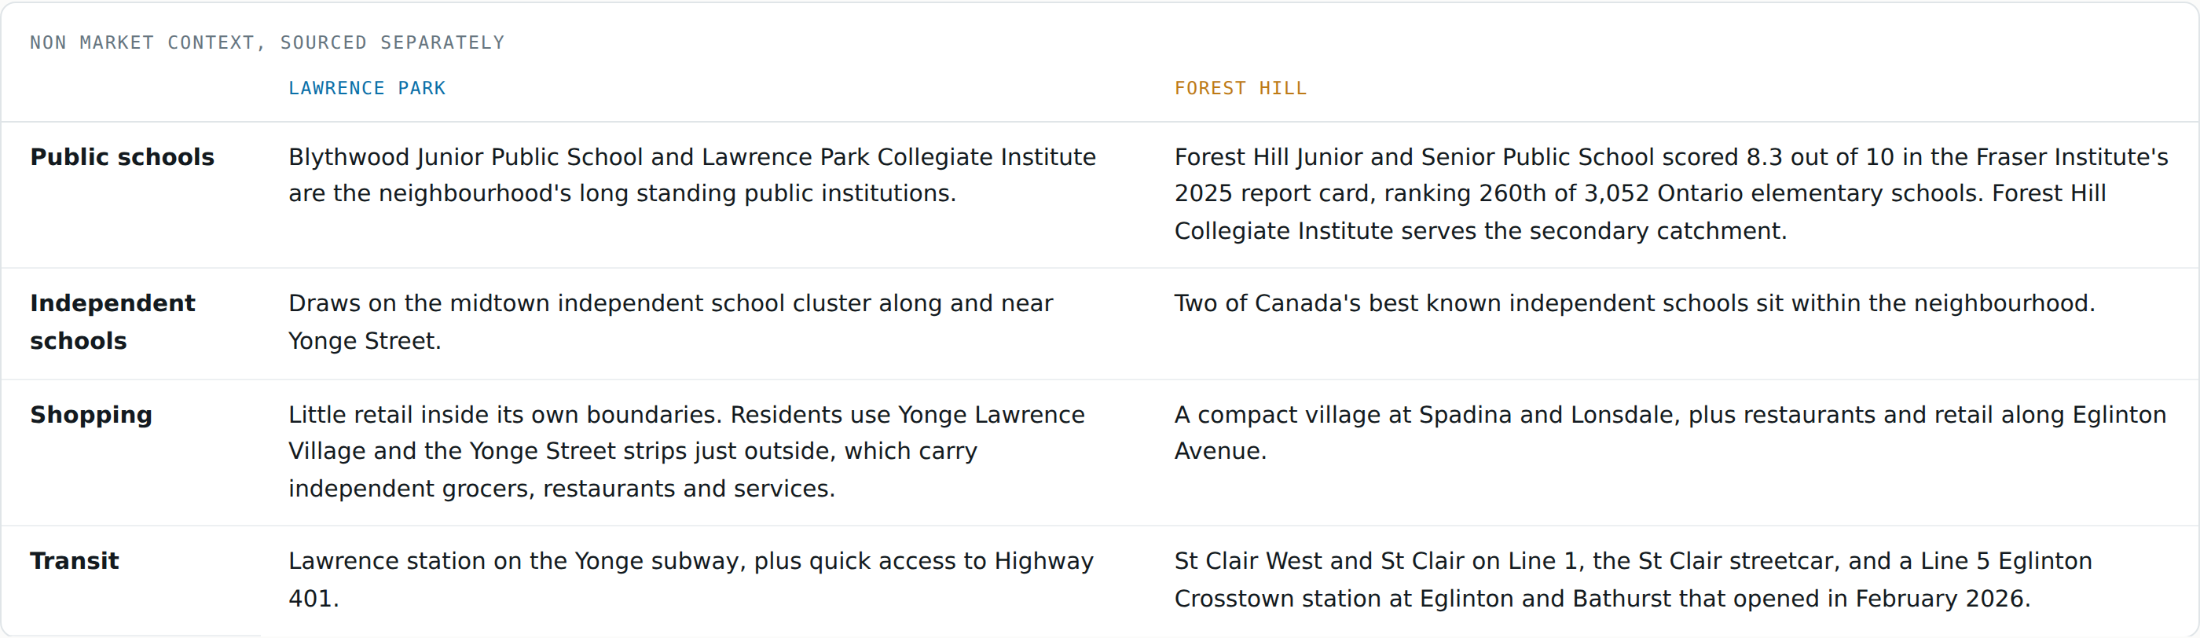
Real estate data explains price. It does not explain why people stay. Both areas are anchored by long established public schools and small retail villages rather than malls, and both have subway access, but the shape of each is different.

I could not find a comparable Fraser Institute score for the Lawrence Park elementary catchment at the time of writing, so I have not quoted one. Where I do not have the number, I would rather say so than estimate it.

The Crosstown station is the one item here that could move numbers rather than describe them. It opened in February 2026, five months before this data, and new transit usually takes longer than that to show up in sale prices. If you believe it will, Forest Hill is the side of that bet. I would want another two or three quarters before I called it.

So which one would I buy

It depends on which risk you would rather carry, and I would not pretend otherwise. Here is how I would put it to a client sitting across from me.

Buy Lawrence Park if:

You care most about being able to sell

It is the deeper market, at more than double the transaction count and nearly double the dollar volume. It sells faster, closer to asking, and with a quarter of sales above list. Its median is up 15.0% year to date against 10.0%, which matters because the median is harder to distort with one or two large sales than the average is.

This is the choice if your horizon might change, or if you would need to exit inside a soft market.

Buy Forest Hill if:

You have patience and want the discount

81.3% of sales close below asking and the average concedes 4.2% off list, so there is genuine room to negotiate. Supply is tightening faster, with new listings down 16.0% against 5.9%. Its share of above asking sales more than doubled from 6.6% to 14.3% in a year, which is the signal to watch.

This is the choice if you can wait for the right house, negotiate hard, and hold through a slower resale.

If you are selling in either:

Price it for the six in ten that fail

Most listings in both neighbourhoods come off the market without selling. That is the base rate you are up against, and it is almost always a pricing decision rather than a marketing one. Forest Hill sellers in particular should look at how their asking price compares to what has actually closed, not to what else is currently listed.

One limit worth being straight about: this data covers sales, not rents. Everything above is a read on capital and resale, not on yield. If you are buying to rent, the rental numbers are a separate exercise and I would not guess at them from this. And nothing here is a prediction. Past market behaviour is not a promise about what either neighbourhood does next.

Sources

MLS market report, Lawrence Park North and South (Toronto C04), July 2026 and year to date. 18 sales in month, 189 YTD.
MLS market report, Forest Hill North and South (Toronto C03 and C04), July 2026 and year to date. 14 sales in month, 91 YTD.
Listing turnover by month of listing, both areas, October 2023 to July 2026. Off market percentages averaged across the monthly cohorts from March 2025 to February 2026, unweighted by cohort size. Cohorts after February 2026 are excluded because recent listings have not had time to resolve.
Fraser Institute, Report Card on Ontario's Elementary Schools 2025, published January 2026.
Neighbourhood retail and transit descriptions compiled from public neighbourhood and transit references, August 2026. Line 5 Eglinton Crosstown opening date reported as February 2026.

Figures are as reported at the time of extraction and will move as sales close and listings resolve. All price figures are sale prices unless the row says list price.

Ali Bolourchi, BSc, MS, PSA, ABR®, Broker · REMAX® Your Community Realty, Brokerage*

Read

The Supply Squeeze Arrives: Listings Plunge 18% as the GTA Market Tightens

For months, TRREB has been telling us the second half of 2026 would look different. July delivered the proof — not with a surge in sales, but with a dramatic pullback in supply. Home sales held essentially steady at 5,995 (down just 0.9% from last July), while new listings collapsed 17.8% to 14,484. When demand holds and supply evaporates, the math only moves in one direction: competition.

Active homebuyers felt it. TRREB reports that buyers faced more competition from other would-be purchasers in July, and if this trend continues, average selling prices could level off in the second half of the year. On a seasonally adjusted basis, sales were actually up month-over-month compared to June, while new listings were down — market conditions tightened as the summer progressed.

July 2026 at a Glance

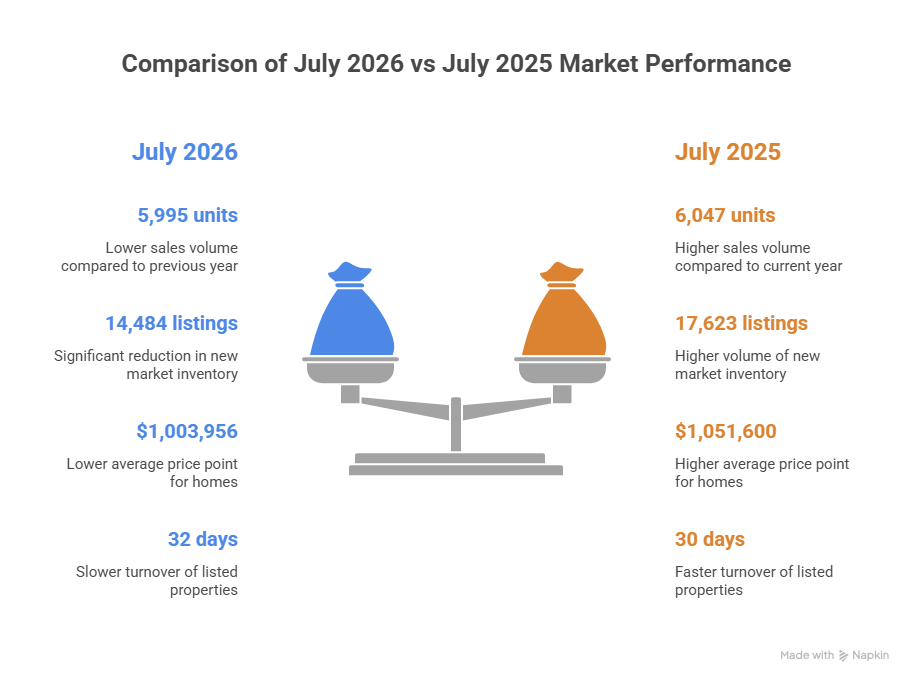
  • Home sales: 5,995 — down 0.9% year-over-year (July 2025: 6,047)

  • New listings: 14,484 — down 17.8% year-over-year (July 2025: 17,623)

  • Active listings: 26,098 — down 12.1% year-over-year

  • Average selling price: $1,003,956 — down 4.5% year-over-year (July 2025: $1,051,600)

  • MLS® HPI Composite: down 4.6% year-over-year

  • Sales-to-new-listings ratio: 41.4% — up sharply from 34.3% a year ago

  • Average listing days on market: 32 (vs. 30 in July 2025)

Read that sales-to-new-listings ratio again. A year ago, roughly one in three new listings found a buyer within the month. This July, it was better than two in five. That is the single clearest measure of the tightening TRREB has been forecasting — and it's why the negotiating room buyers enjoyed through 2025 is shrinking.

Detached Homes: The 416 Quietly Outperforms

Detached homes accounted for 2,789 sales — 46.5% of all GTA transactions — at an average price of $1,291,690 (down 5.1% year-over-year).

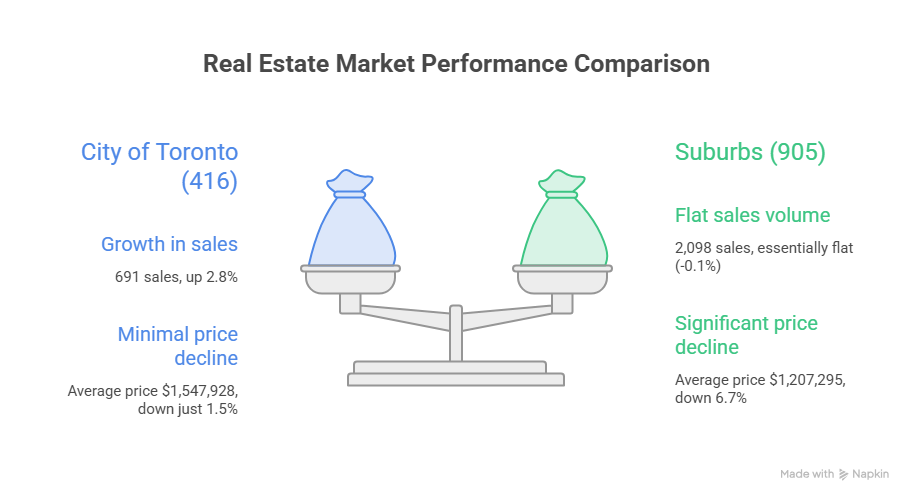
  • City of Toronto (416): 691 sales, up 2.8% — average price $1,547,928, down just 1.5%

  • Suburbs (905): 2,098 sales, essentially flat (-0.1%) — average price $1,207,295, down 6.7%

Insight: The 416/905 divergence is becoming the story of the detached market. Toronto proper posted rising sales and near-stable prices, while the 905 continued to absorb the bulk of the price adjustment. For move-up buyers eyeing the city, the discount window is narrowing faster than the headlines suggest.

Semi-Detached: July's Soft Spot

Semi-detached homes recorded 557 sales at an average price of $964,922, down 7.4% year-over-year — the largest price decline of any major home type this month.

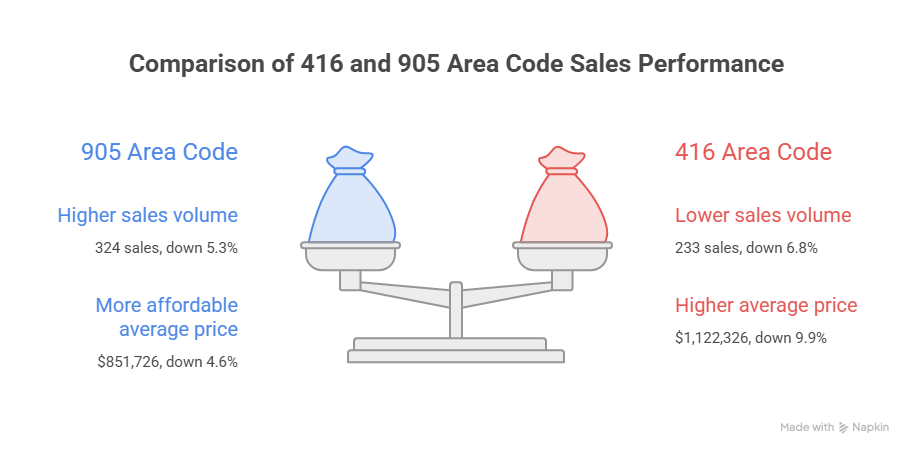
  • 416: 233 sales, down 6.8% — average price $1,122,326, down 9.9%

  • 905: 324 sales, down 5.3% — average price $851,726, down 4.6%

Insight: A near-10% annual price drop on Toronto semis is a genuine opportunity flag. Semis are the classic first move-up rung, and when they lag the broader market this much in a tightening supply environment, they rarely stay discounted for long.

Townhouses: Toronto Demand Jumps

Townhouses posted 1,003 sales at an average price of $817,213, down 3.9% year-over-year.

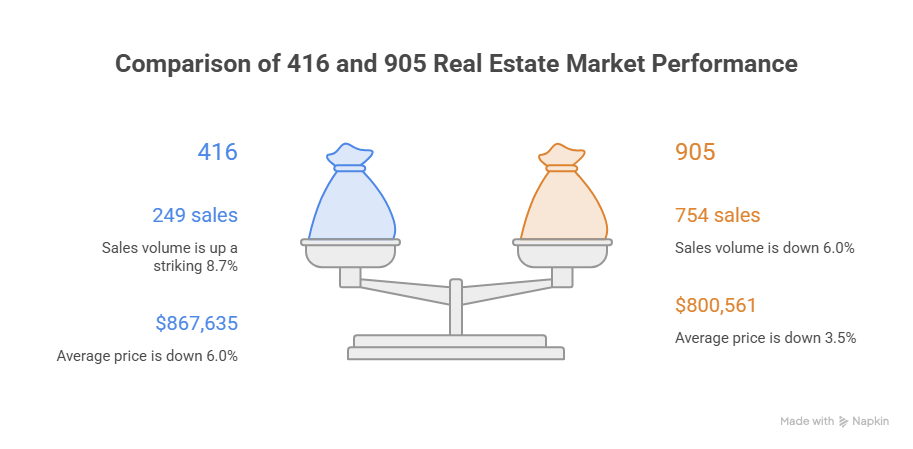
  • 416: 249 sales, up a striking 8.7% — average price $867,635, down 6.0%

  • 905: 754 sales, down 6.0% — average price $800,561, down 3.5%

Insight: An 8.7% sales jump in the 416 tells us affordability-driven buyers are converging on the townhouse segment — the last family-friendly format under $900K in the city. Expect this segment to firm up first if the supply squeeze persists into fall.

Condo Apartments: The Bottom Keeps Forming

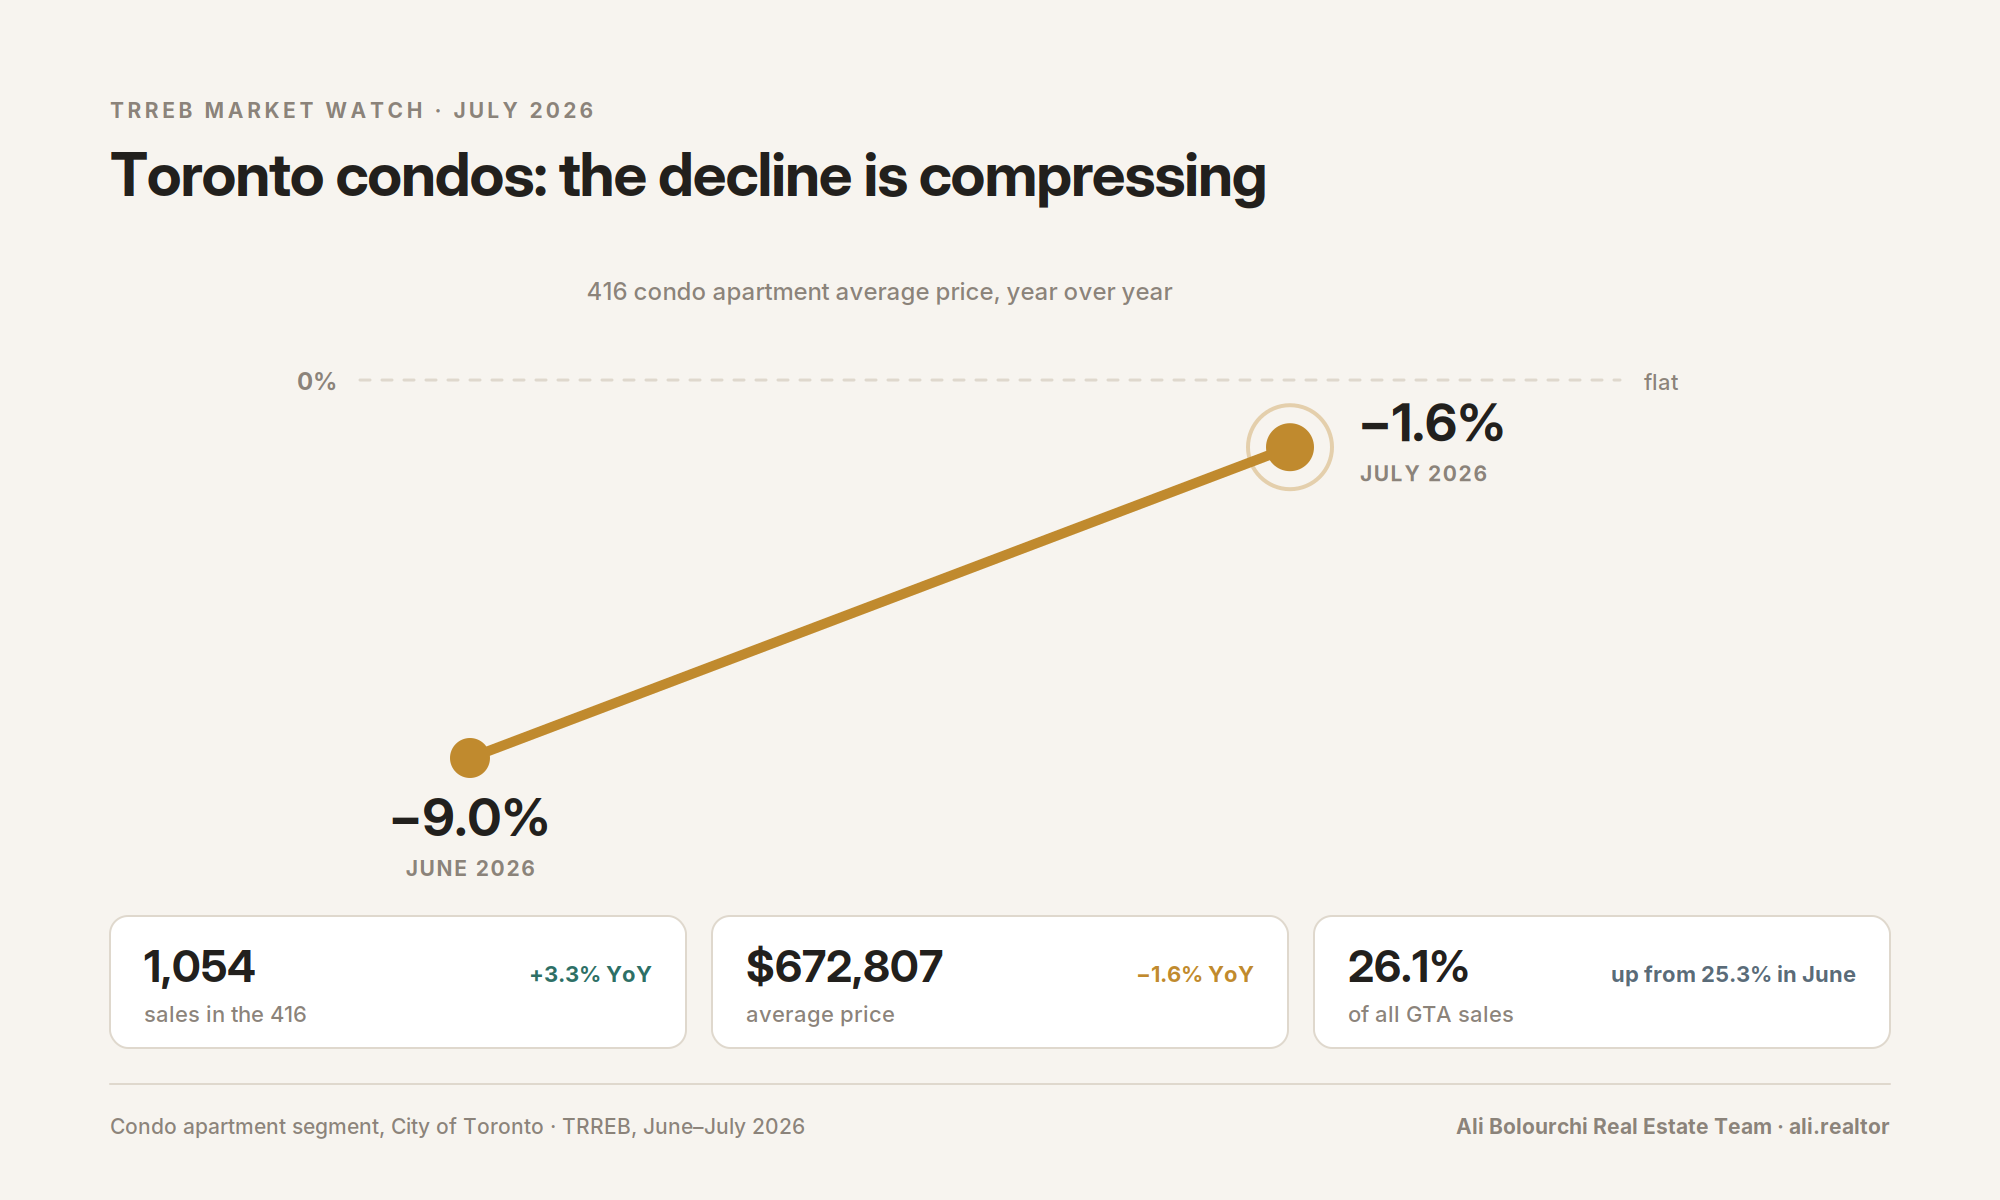
Condo apartments recorded 1,564 sales — 26.1% of the market — at an average price of $636,323, down just 2.3% year-over-year.

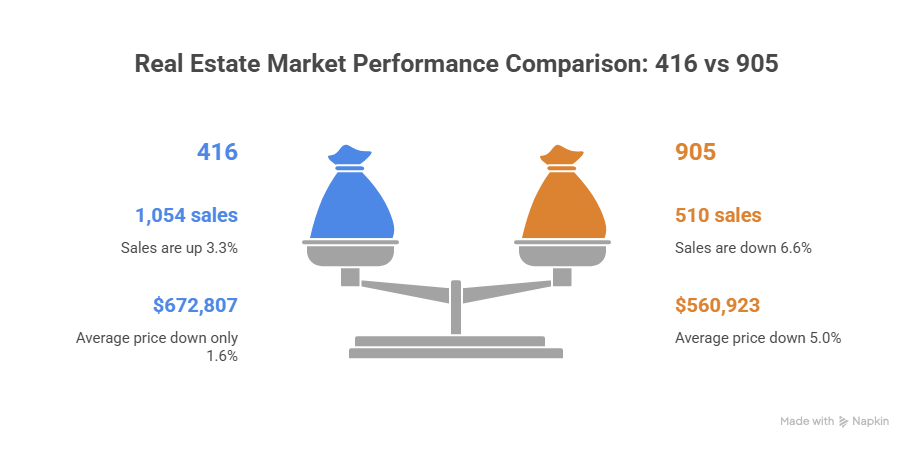
  • 416: 1,054 sales, up 3.3% — average price $672,807, down only 1.6%

  • 905: 510 sales, down 6.6% — average price $560,923, down 5.0%

Insight: Six months ago, Toronto condo prices were falling at a high single-digit annual pace. In July, the decline was 1.6%. That is what a bottom looks like while it's forming: sales rising, price declines compressing toward zero. Investors waiting for a bell to ring should understand — this is the bell.

The Economic Backdrop

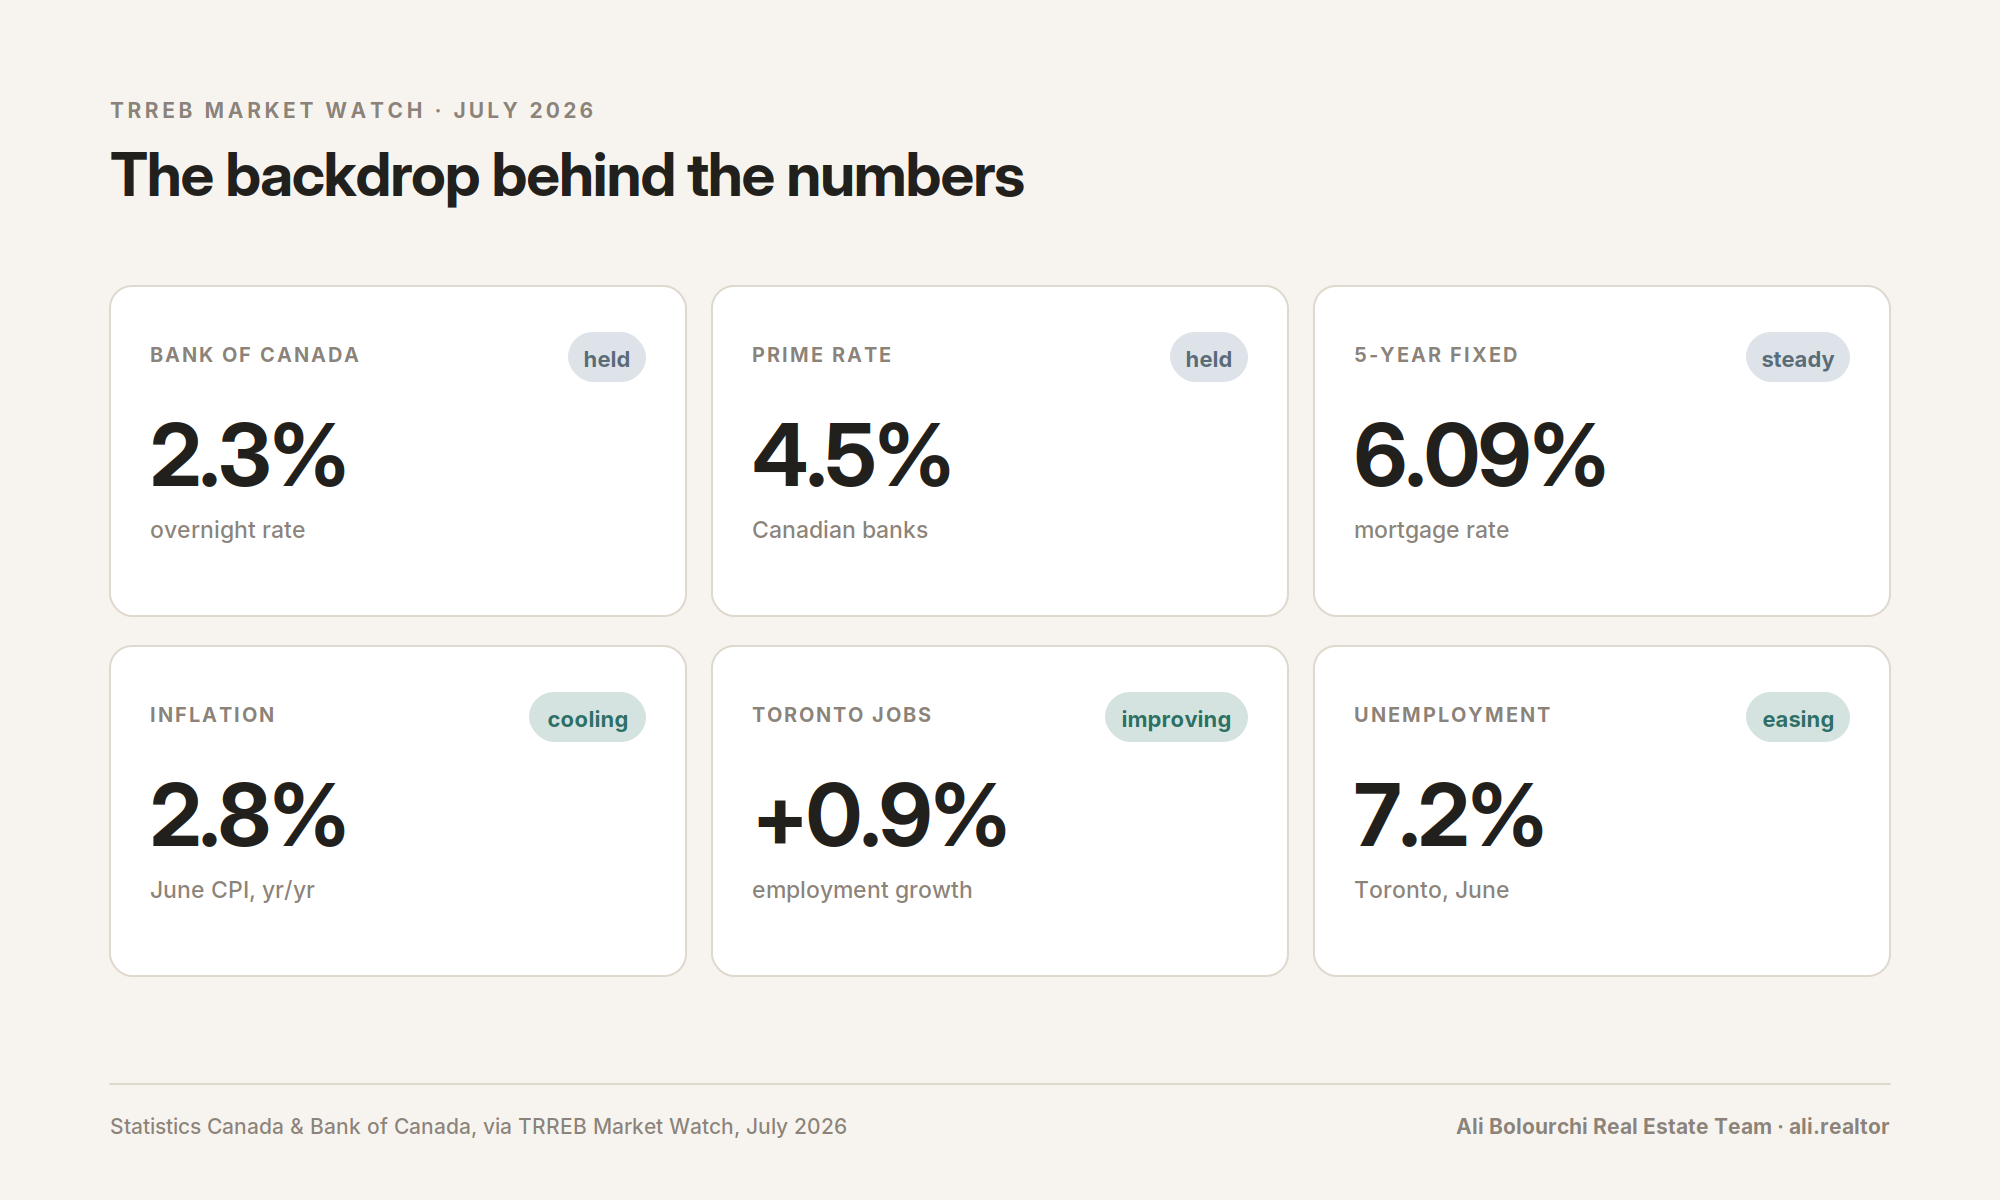
The macro picture improved more than expected. Toronto employment grew 0.9% in June and the unemployment rate eased to 7.2%. Inflation cooled to 2.8%, the Bank of Canada held its overnight rate at 2.3% (prime: 4.5%), and mortgage rates were steady — 5.49% for 1-year, 6.05% for 3-year, and 6.09% for 5-year terms.

TRREB President Daniel Steinfeld framed the tightening plainly: "With sales accounting for a larger share of listings, buyers may find there is less room to negotiate moving forward. If current trends continue, home prices could start to level off compared to last year." He noted many would-be buyers are still waiting for clarity on tariffs, inflation and borrowing costs.

Chief Information Officer Jason Mercer added a note of optimism: "The latest readings on economic growth and jobs surprised to the upside. This could help bolster consumer confidence and prompt an uptick in home purchases in the months ahead, especially if home prices stabilize as we move through the fall."

And CEO John DiMichele pointed to the policy front ahead of the municipal election: "Restrictive zoning, outdated rules, high taxes and fees, and approval delays are making housing more expensive… They add tens of thousands of dollars to the cost of every home and need to be reformed."

What This Means for You

If You're Buying

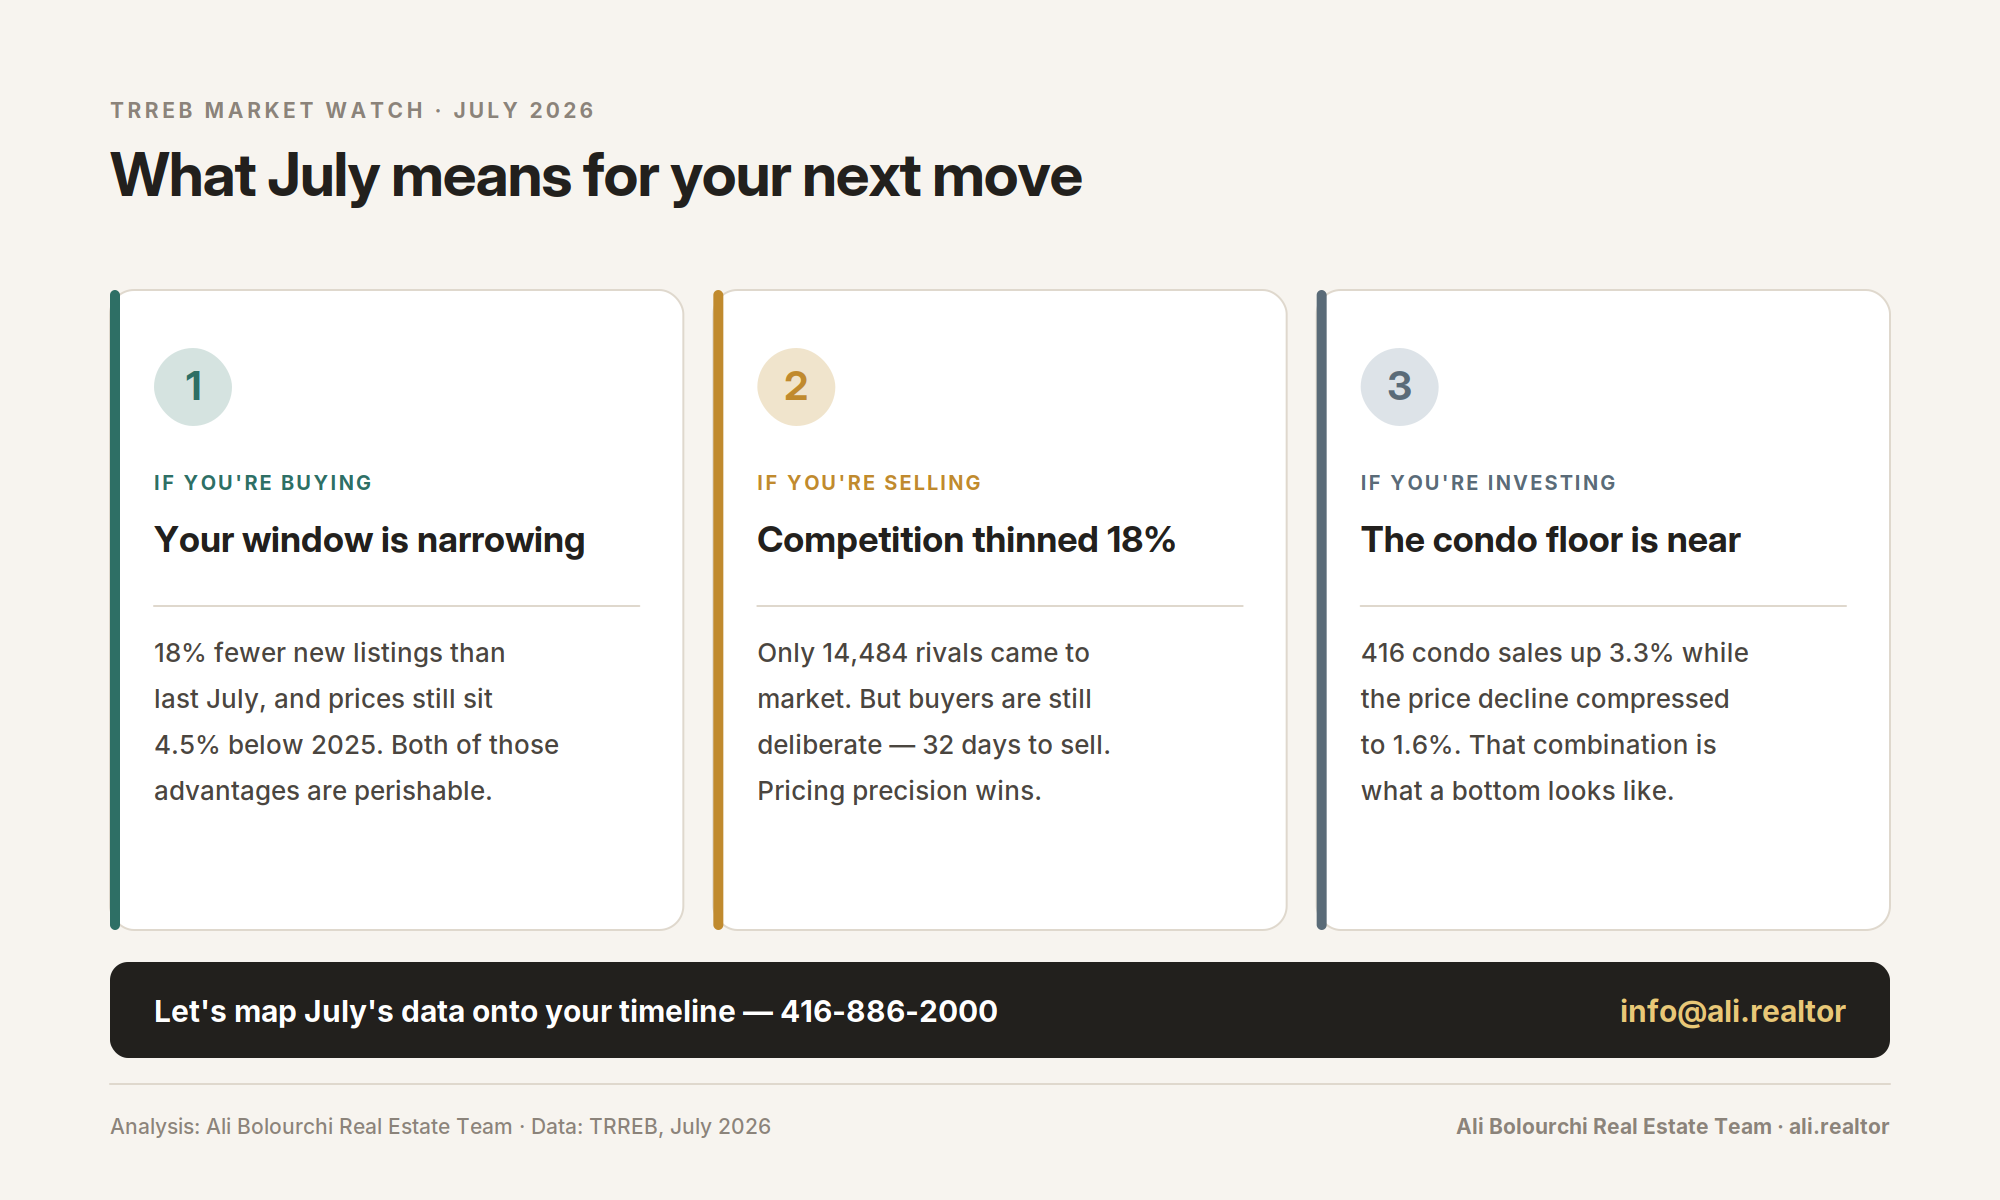
The window is closing — not slammed shut, but closing. With 18% fewer new listings and a sales-to-new-listings ratio at 41.4%, the leverage you had last summer is measurably reduced. Prices are still 4.5% below last year; that discount and today's negotiating room are both perishable. Get pre-approved, define your target segment, and be ready to act decisively.

If You're Selling

July handed you the best competitive setup in years: 17.8% fewer rival listings. But note the days-on-market figures — 32 days listed, 45 days total on market — buyers are still deliberate. Well-prepared, correctly priced homes are winning; aspirational pricing still sits. Strategy, staging and pricing precision matter more than ever.

If You're Investing

The condo data is doing the talking: rising 416 sales volumes with price declines compressed to 1.6%. Rental fundamentals remain supported by an average price point ($672,807 in the 416) that keeps ownership out of reach for many tenants. For a 3–5 year horizon, this remains an accumulation phase.

Where does July's data leave your plans?

Every market shift creates winners and waiters. Let's talk about which side of that line your strategy puts you on — with numbers specific to your neighbourhood, property type and timeline.

Read
This website may only be used by consumers that have a bona fide interest in the purchase, sale, or lease of real estate of the type being offered via the website. The data relating to real estate on this website comes in part from the MLS® Reciprocity program of the PropTx MLS®. The data is deemed reliable but is not guaranteed to be accurate.