


Welcome to the Q1 2026 Market Update.
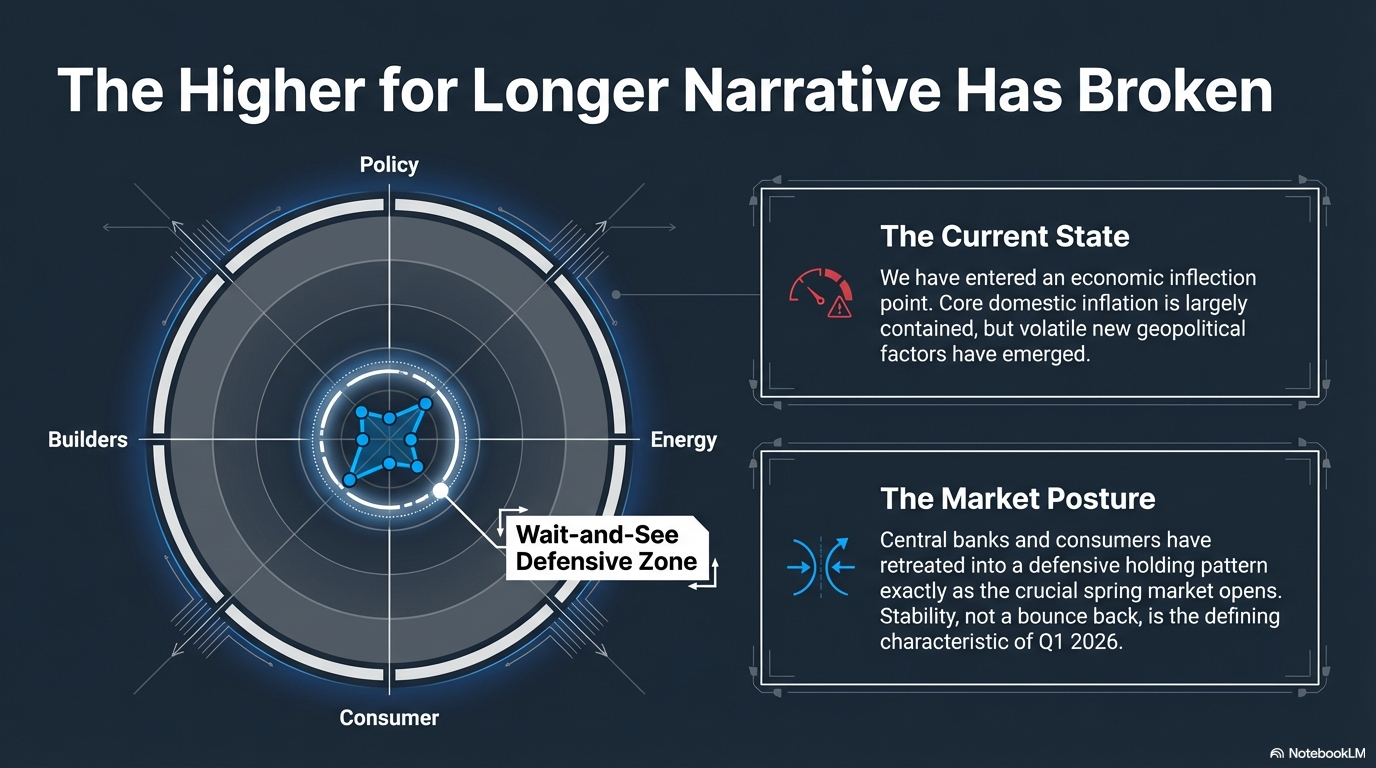
We are currently navigating an economic inflection point. The narrative of "higher for longer" that dominated 2024 and much of 2025 has been replaced. While the core inflationary threat has been largely contained, new, volatile factors have emerged, particularly in geopolitics and energy, forcing central banks into a defensive "wait-and-see" posture just as the crucial spring market opens.
We have compiled the latest critical indices for the US and Canada. This post moves beyond the surface numbers to analyze the why behind the trends and what you should be looking forward to as we enter the most active real estate and economic quarter of the year.
Section 1: The Central Bank Divergence and Its Impact
We begin with the primary drivers of all market activity: interest rates. While both the Federal Reserve and the Bank of Canada (BoC) are on a path of synchronization (holding rates), a significant divergence in their absolute rate levels has defined the landscape.
Interest Rate Policy Standoff
The single most important visualization of the current economy is the divergence in the target rates of the world’s two most connected economies. While the US economy, bolstered by stronger-than-expected GDP and consistent job growth, has given the Fed room to keep rates elevated (the upper end of the target is 5.00%), the Bank of Canada, facing a much more fragile consumer base and an earlier victory over domestic inflation, has settled into a comfortable rate of 2.25%.
This 250+ basis point gap (between the effective Fed Funds 4.75% and the BoC 2.25%) is intentional, designed by the BoC to support the heavily indebted Canadian household. We visualize this divergence over the past three years.
VISUAL 1: The Central Bank Rate Divergence

Image 1 Analysis: The Divergence Gap. The chart in Image 1 perfectly captures the story. We track the path from early 2023 through March 2026. Note how, after peaking, the Canadian Policy Rate (the dashed red line) has aggressive, descending steps, stabilizing at 2.25%, while the US Fed Funds Rate (solid blue line) remains elevated, creating a widening chasm. This gap is the reason why the USD/CAD exchange rate has pushed to $1.39 (up 1.5% in 30 days), as global capital moves toward higher yields in the US.
Section 2: The Canadian Consumer Squeeze
While the Bank of Canada has aggressively lowered rates, the Canadian consumer is still fighting a historic battle. The stabilization of rates in early 2026 (the "BoC pause") has done little to alleviate the structural debt load.
Debt-to-Income vs. Confidence
Canadian Household Debt-to-Income is at a staggering, all-time high of 177.2%. For every $1 of disposable income, Canadians now owe $1.77. This debt is the anchor on the spring market. This ratio is visualized below alongside Consumer Confidence, which remains at near-historic lows (-3%), a clear signal that households feel overextended.
VISUAL 2: The Canadian Consumer Debt Cliff

Image 2 Analysis: A Strained Household. Image 2 visualizes the data points explicitly. The thick purple line (Debt Ratio) trends up remorselessly, hitting the 177.2% peak, just as the thin orange line (Consumer Confidence) plunges below a neutral midpoint (the horizontal line), flattening near its historical bottom at -3 points. A distressed consumer icon sits at the intersection. This chart explains why the 3% vacancy rate (the renter pivot) is holding: buyers simply cannot qualify, even at lower interest rates.
Section 3: Real Estate Realities and the Builder Standoff
The most significant red flag for the Spring 2026 market, and for the next five years of supply, is the collapse of builder confidence. The Canadian Home Builders' Association (CHBA) indices (0–100 scale, where <50 is "poor") have reached critical lows.
Single-Family HMI: 26.4
Multi-Family HMI: 14.7 (Record low)
Builders: Pencils Down
Builders are "pencils down" on new projects. Financing costs, regulatory barriers, and soft consumer demand (driven by the debt visualized above) mean very few new foundations are being poured. While the Teranet-National Bank Composite Index (prices) is only down -1.6% year-over-year, the slowdown is happening in new construction, baking a future supply crisis into the market today.
VISUAL 3: The Builder Confidence Collapse
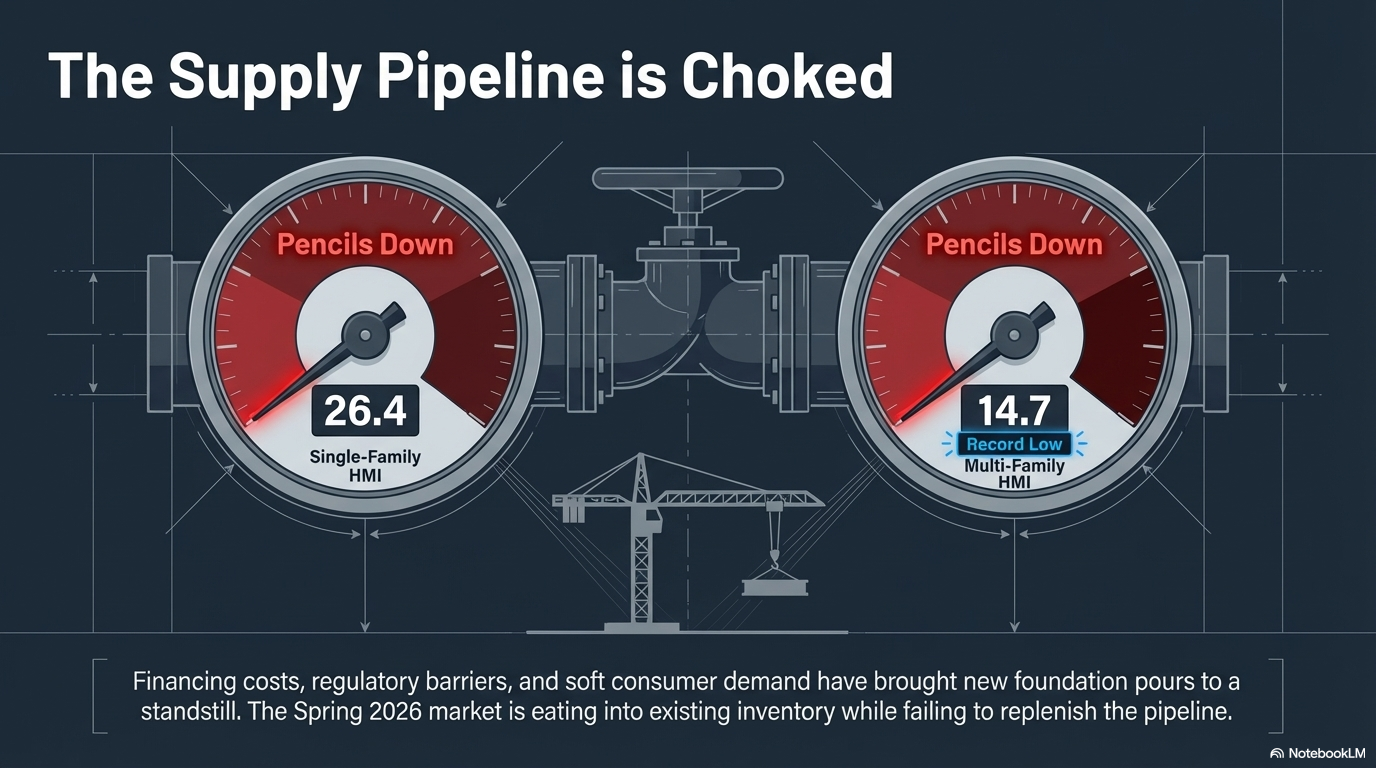
Image 3 Analysis: Supply Shortage Baked In. Image 3 is a multi-part visualization. On the left, two distinct odometers, the CHBA Single-Family (26.4) and the Record-Low Multi-Family (14.7), are deeply stuck in the red "Pencils Down" zone, alongside an abandoned construction crane. On the right, the graphic charts the impact: only a small group of foundations in 2026 (the current slow market) leads to a massive visualized supply shortage (the demand gap, the high-rise in 2028–2030) as population growth outpaces completions. For buyers, this is a clear message: current price softness is temporary.
Section 4: The Commodities/Inflation Threat
We must address the volatile new factor that has complicated the spring market and the central bank narrative: Energy.
WTI Crude: The Price Spike and Its Ripple Effect
The recent geopolitical conflict in the Middle East has driven WTI Crude to a spiked value of $94.40. This energy shock has directly translated to higher costs for consumers. We are seeing Gasoline hit $3.98 USD/Gal (a $1 spike in 30 days in the US) and CA Inflation (CPI) uptick slightly to 2.4% as of March data.
This energy spike acts as a "stealth tax" on consumers and forces the BoC to hold rates at 2.25% to manage headline inflation, even as the rest of the domestic economy is in stagnation.
VISUAL 4: The Energy Price and Inflation Impact
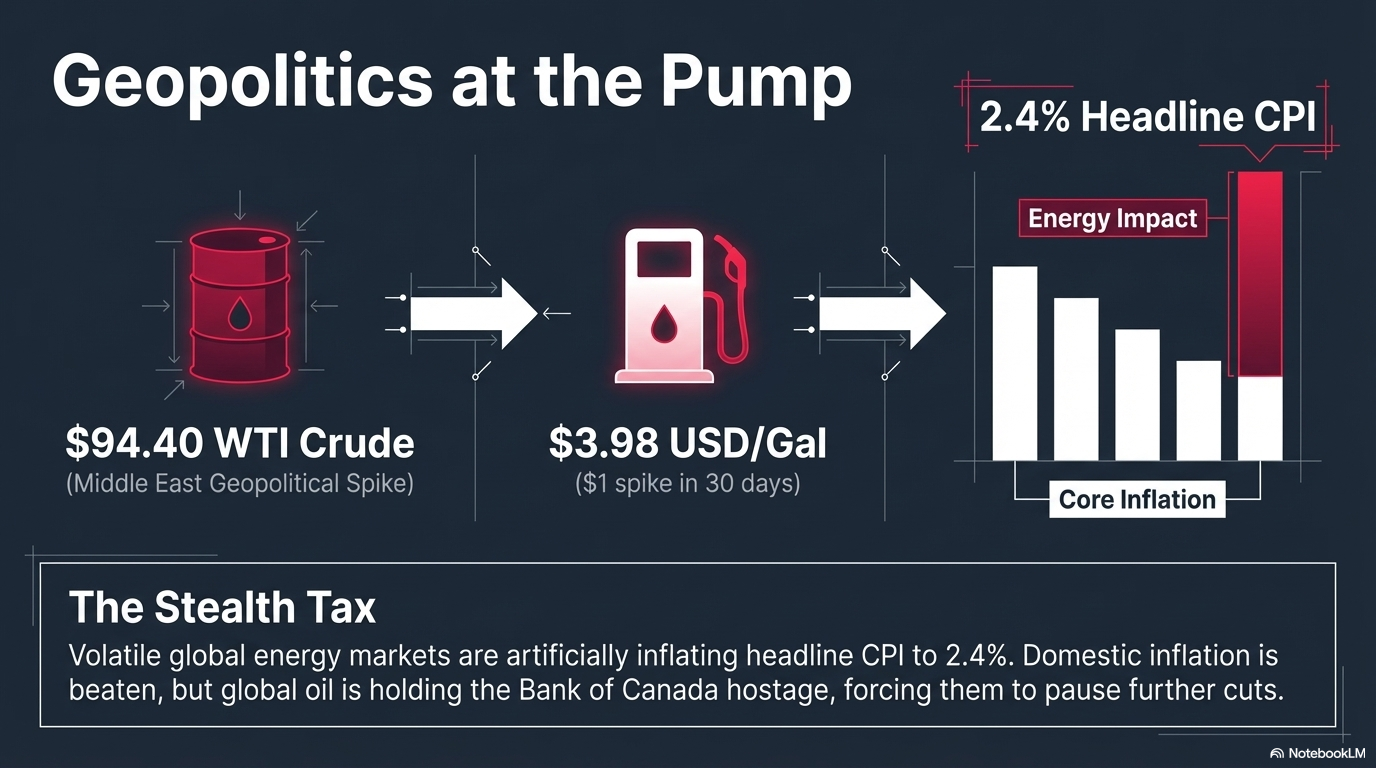
Image 4 Analysis: The Stealth Tax. Image 4 visualizes the energy threat. On the left, a stylized crude barrel ($94.40) and gasoline pump ($3.98/Gal) display large, glowing orange numbers. An arrow connects them to the right-hand column/line chart, which shows "CA Inflation (CPI) with Energy Cost Impact" over a 2023–2026 timeline. A base "Core Inflation" (purple bars, decreasing toward 2%) is visualized. But the real "Headline CPI" line (blue) has a sharp spike in early 2026, labeled 2.4% Uptick, caused entirely by the red stacked segment labeled "Energy Impact."
Section 5: Summary and Conclusion: The Great Hesitation
As the Spring 2026 market begins, "stability, not bounce back" is the mantra. Buyers with high down payments are finding opportunities in a market where the Teranet index shows a slight price correction (-1.6% y/y), but the average Canadian household is simply hesitating. They are staying put until the geopolitical dust settles and the long-forecasted path of significant interest rate cuts (into the 1%–1.5% range) finally arrives.
For investors, the critical data point to watch is the Builder Confidence Multi-Family HMI at 14.7. This is the record low that ensures massive supply imbalances in the coming years. Those with capital today are looking past the "great hesitation" of 2026 and positioning for the next decade.
