Introduction: A New Path for Toronto Real Estate Investors
For investors in the Greater Toronto Area, the rules of multi-unit real estate have fundamentally changed. Profitability is no longer just about location and market timing; it's about purpose. The government's most powerful financing tool, the CMHC MLI Select program, has been redesigned to directly link an investor's financial success to their project's social and environmental impact. This guide is your strategic playbook for mastering this new equation.
As a commercial mortgage broker specializing in CMHC financing, I will break down the core components of MLI Select, explain the critical new rules that took effect in 2025, and provide a clear blueprint for how you can leverage this program to achieve your financial goals while making a meaningful contribution to housing affordability and sustainability.
1. The Big Picture: Understanding the GTA's Current Rental Market
Before diving into the specifics of MLI Select, it's essential to understand the landscape you'll be operating in. The 2025 CMHC Rental Market Report revealed several key dynamics that every new investor in the GTA should be aware of.
Softening Market Conditions
An increase in rental supply combined with weaker demand from renters has caused vacancy rates to rise. For the first time since the pandemic, the vacancy rate for purpose-built rental apartments in Toronto reached 3.0%. For an investor, this means a slightly less frantic market, but also more competition to attract and retain tenants.
The Key Role of Tenant Turnover
While average rents for new tenants have stalled or even declined slightly, overall rent growth is still happening. The primary driver of this increase is tenant turnover. When a unit becomes vacant, landlords can reprice it to current market rates, which are often significantly higher than what a long-term tenant was paying. This makes managing turnover a critical part of a landlord's financial strategy in Toronto.
Competition from Condominiums
The GTA has seen a surge in condominium apartments being offered on the rental market. As the ownership market has weakened, many condo owners have opted to rent out their units instead of selling. This influx of newer, often well-located units adds significant competitive pressure to the traditional, purpose-built rental market.
Persistent Affordability Challenges
Despite the overall vacancy rate rising, the market for the most affordable rental units remains extremely tight. The vacancy rate for the least expensive units is under 1%, indicating that demand from lower-income renters far outstrips supply.
These trends highlight a core challenge: while the market is competitive, there is a clear and pressing need for specific types of housing, particularly affordable units. This is precisely the gap that the CMHC MLI Select program is designed to fill.
2. What is the CMHC MLI Select Program? A Powerful Tool for Investors
In simple terms, MLI Select is a mortgage loan insurance product offered by CMHC. Its core purpose is to incentivize private developers and investors to create multi-unit rental properties that help solve Canada's most pressing housing challenges: affordability, energy efficiency, and accessibility. In exchange for building projects that meet these social goals, CMHC provides insurance that unlocks exceptional financing terms from lenders.
For an investor, the benefits are transformative compared to conventional financing:
Higher Leverage
The program allows for a Loan-to-Value (LTV) or Loan-to-Cost (LTC) of up to 95%. This means you could potentially secure financing with a down payment as low as 5%, dramatically reducing the initial capital required to get a project off the ground.
Longer Amortization
MLI Select offers amortization periods of up to 50 years. A longer amortization significantly lowers monthly mortgage payments, which improves your property's monthly cash flow and makes projects more financially viable, especially in the early years.
Better Financing Terms
Because CMHC insurance protects the lender against default, lenders can offer lower interest rates and reduced insurance premiums compared to conventional commercial loans. This reduces the overall cost of borrowing over the life of the mortgage.
These powerful incentives are not automatic. To unlock them, your project must score points in a system designed to measure its social and environmental impact.

3. The Heart of the Program: Mastering the MLI Select Points System
The entire MLI Select program is built on a points system. The more points your project scores, the better the financing terms you can access. To qualify, a project must achieve a minimum of 50 points, but savvy investors aim for 100+ points to maximize their benefits. Points are awarded across three "pillars":
Affordability
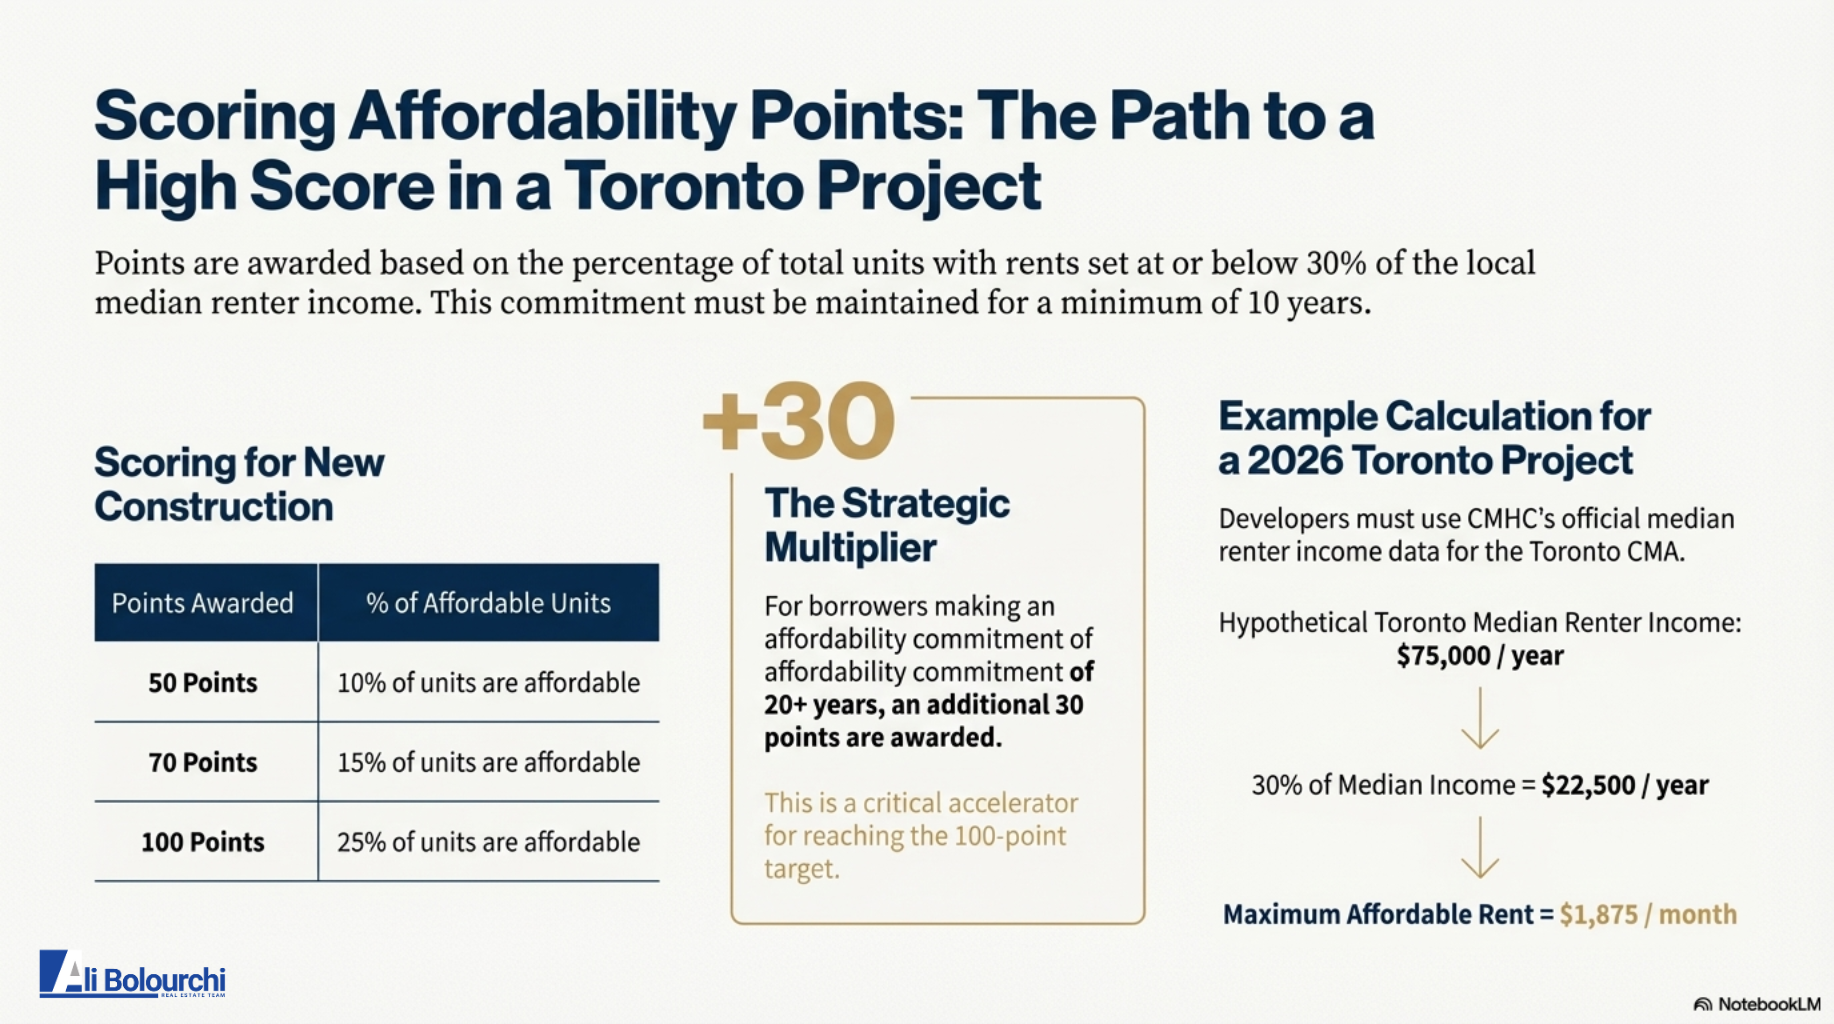
This is achieved by committing to rent a certain percentage of your units at or below 30% of the local median renter income. This commitment must be maintained for at least 10 years.
Energy Efficiency
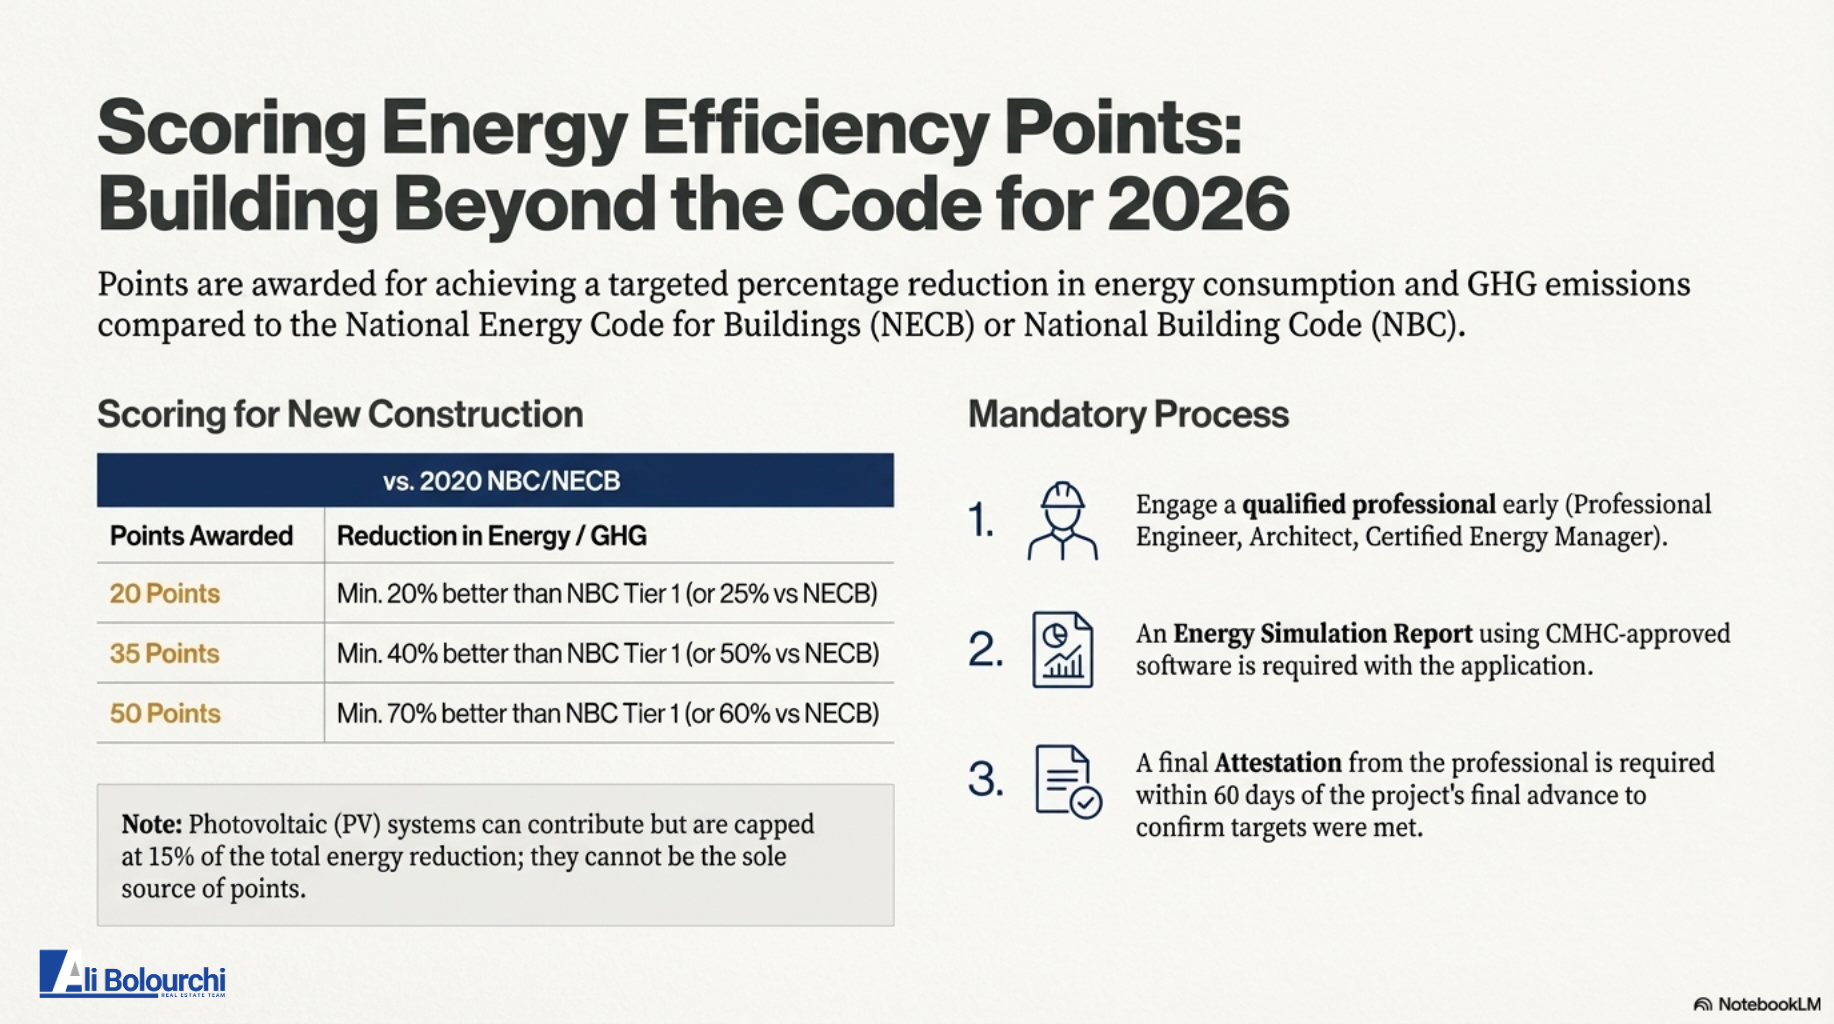
Points are awarded for designing a new building or retrofitting an existing one to achieve energy consumption and GHG emission reductions that exceed the standards of the National Energy Code.
Accessibility
This involves incorporating universal design principles and accessibility features for people with mobility challenges, based on standards like the CSA B651:23. This can range from making common areas barrier-free to ensuring a percentage of units are fully accessible.
Illustrate the Tiers of Success
For a new construction project, the benefits scale directly with your point score. The strategic goal is to reach 100 points to unlock the best possible terms.

A Strategic Blueprint for Success
Reaching 100 points is more achievable than it might seem, especially when you leverage long-term commitments. Here is a cost-effective "100-Point Blueprint" for a hypothetical 12-unit new construction project in Toronto:
Pillar 1: Affordability (80 Points)
Commit just 10% of your units (2 out of 12) to affordable rents. This initial commitment earns 50 points.
Critically, commit to maintaining these affordable rents for 20+ years instead of the minimum 10. This long-term commitment grants a +30 point bonus.
Total Affordability Score: 80 Points
Pillar 2: Accessibility (20 Points)
Design the building to meet the mandatory accessibility baseline: 100% of units must be "visitable" and all common areas must be barrier-free, as defined by the CSA B651:23 standard.
Ensure a minimum of 15% of the total units (2 out of 12) are fully accessible according to CSA standards. This combination earns 20 points.
Total Accessibility Score: 20 Points
Pillar 3: Energy Efficiency (0 Points)
With 100 points already achieved through affordability and accessibility, no additional points are needed from this pillar. This allows you to build to the standard 2020 National Building Code without incurring the extra costs associated with higher-tier energy efficiency measures.
This strategic approach allows an investor to unlock the maximum financing benefits while minimizing additional construction costs. Understanding this points system is the first step; the next is navigating the new cost structure that CMHC introduced in 2025.
4. The New Math (Post-July 2025): How Your Premium is Calculated
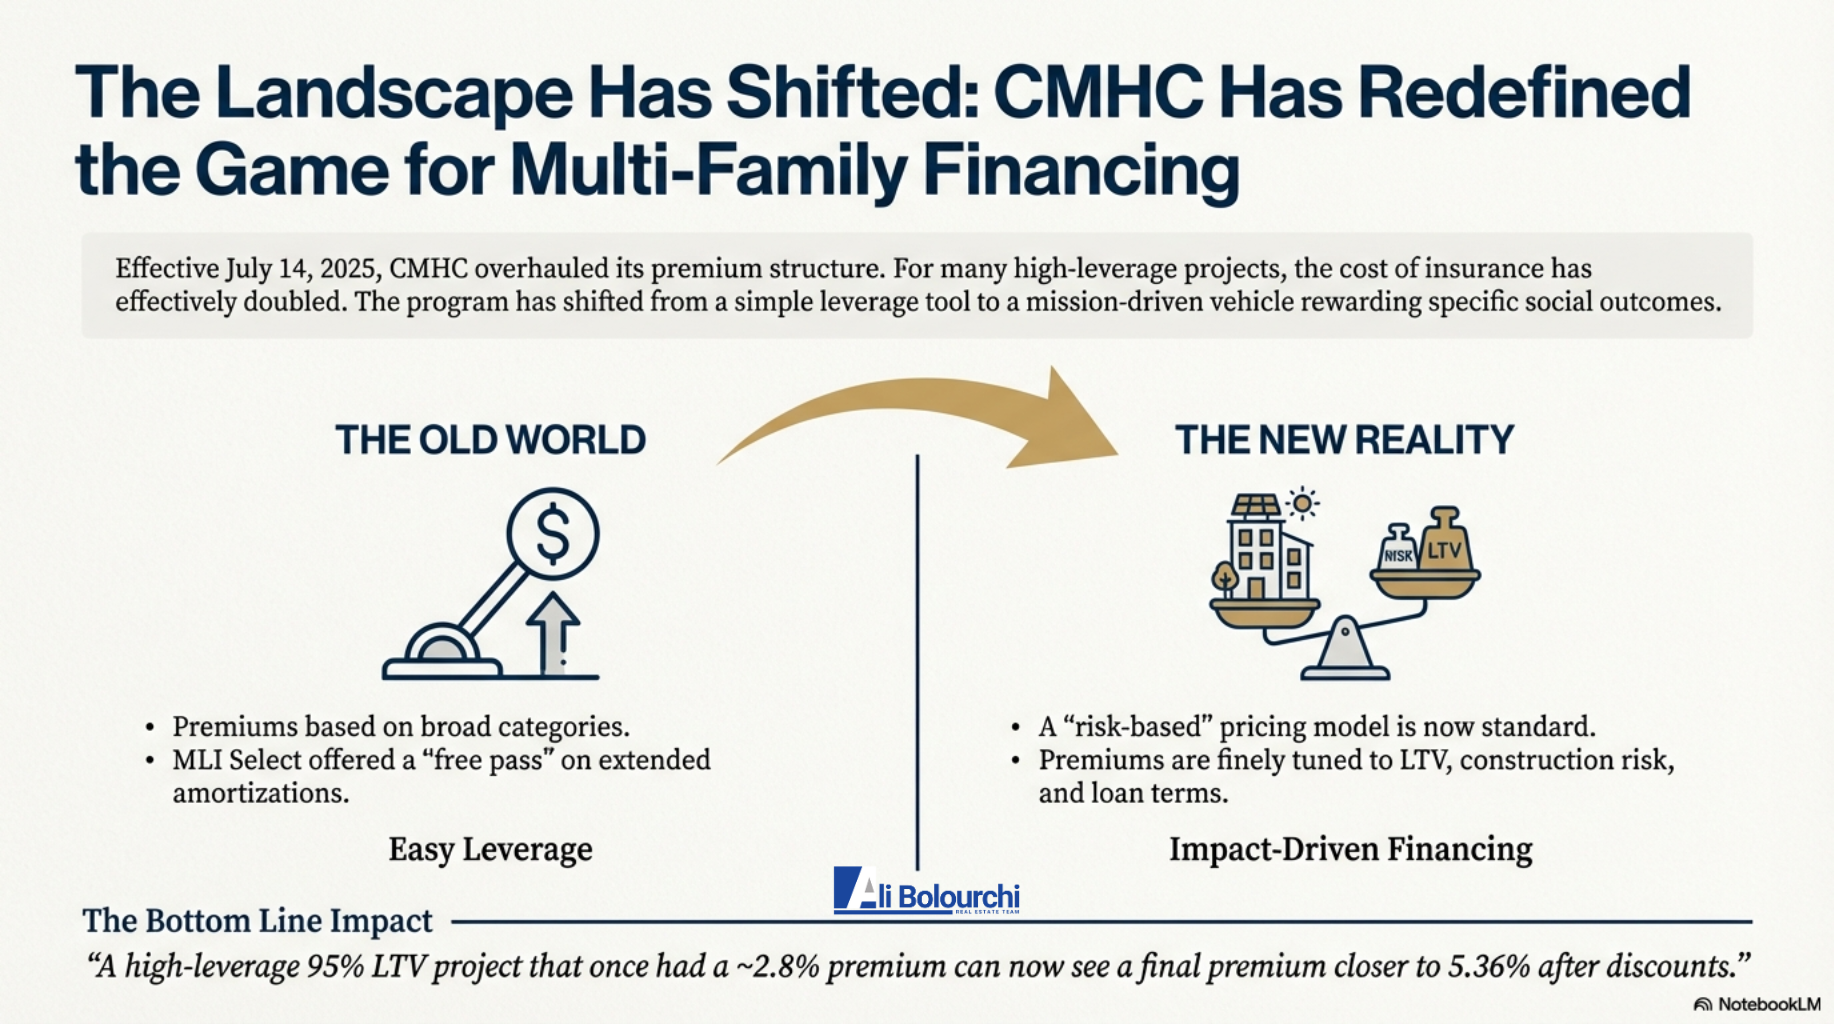
For applications submitted on or after July 14, 2025, CMHC overhauled its premium structure for multi-unit mortgage insurance. It is now essential for investors to understand this new "risk-based" pricing to accurately model a project's financial returns. The final premium you pay is now a three-part calculation.
Base Premium Rate
This is your starting point. The rate is determined primarily by your project's risk, which CMHC measures through the Loan-to-Value (LTV) or Loan-to-Cost (LTC) ratio and whether it's a new construction or an existing property. Simply put: the higher your leverage, the higher your base premium.
Applicable Surcharges
Additional fees are added on top of the base premium for certain features that increase the loan's risk. The most common surcharge is for extended amortization periods. Any amortization beyond 25 years will have a surcharge added.
MLI Select Discount
This is your reward for achieving social outcomes. Based on your project's point score, a percentage discount is subtracted from the total of your Base Premium and Surcharges. The discounts are:
50 Points: 10% discount
70 Points: 20% discount
100+ Points: 30% discount
Show, Don't Just Tell
The power of aiming for 100 points becomes clear when you compare two financial models. Let's look at a "Minimum Viable" 50-point project versus a "Strategic Max-Out" 100-point project.
The "So What?"
The table reveals a crucial insight: the 100-point strategy is financially superior. Even though Project B uses higher leverage (95% vs. 85%) and a longer amortization (50 vs. 40 years)—both of which increase the raw premium—the powerful 30% discount results in a lower final premium rate. An investor using the 100-point strategy puts less money down, improves their monthly cash flow, and—counter-intuitively—still pays less in total insurance costs. This is the new math of purpose-driven investment.
5. The Gates to Entry: Verifying Borrower and Project Eligibility
Before you can even begin scoring points, you and your project must meet CMHC's fundamental eligibility requirements. These are the non-negotiable gates to entry.
Borrower Requirements Checklist
Experience: You must have a minimum of 5 years of experience managing similar multi-unit residential properties.
Alternative: If you lack this experience, you can satisfy the requirement by having a formal contract with a professional third-party property management firm.
Net Worth: You must have a minimum net worth equal to at least 25% of the total loan amount, with an absolute minimum of $100,000.
Strategic Note: CMHC may offer flexibility on this requirement for projects that achieve 100+ points.
Project Requirements Checklist
Minimum Size: The property must have at least 5 rental units.
Mixed-Use Limits: If the property includes commercial space (e.g., retail on the ground floor), the non-residential portion cannot exceed 30% of the gross floor area or 30% of the total lending value.
Foreign Ownership: The project cannot be subject to the Prohibition on the Purchase of Residential Property by Non-Canadians Act.
Once you've confirmed you meet these baseline criteria, you can move forward with the application process.

6. The Application Roadmap: A 5-Step Process from Submission to Funding
The application process for an MLI Select-insured loan is thorough and requires careful planning. Understanding the timeline and key milestones is crucial for managing expectations.
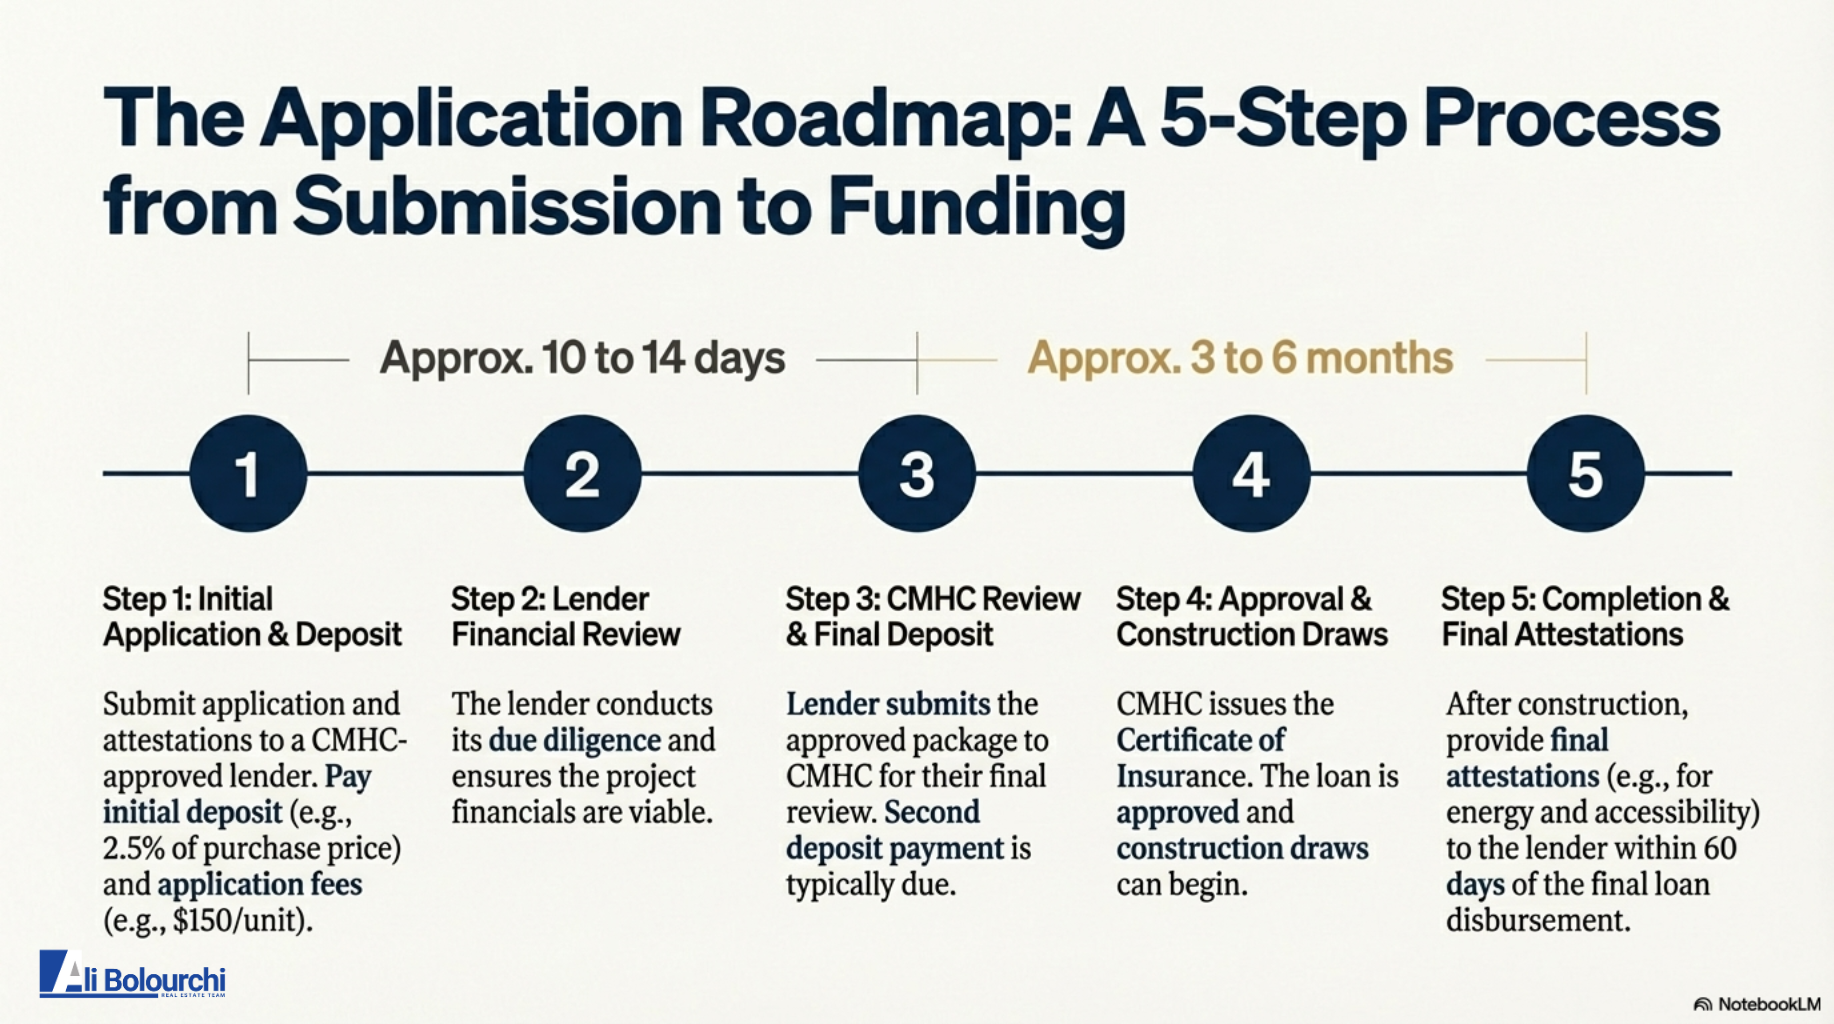
Initial Application & Deposit
Submit your application forms and signed attestations (for affordability, accessibility, etc.) to a CMHC-approved lender. At this stage, you will pay the initial application deposit and application fees (calculated based on the number of units).
Lender Financial Review (Approx. 10-14 days)
The lender performs its own due diligence. They will review your financials, analyze the project's pro forma, and ensure the deal is viable before submitting it to CMHC.
CMHC Review & Final Deposit (Approx. 3-6 months)
Once the lender approves the package, it is sent to CMHC for their detailed review. This is the longest part of the process. A second deposit payment is typically due at this stage.
Approval & Construction Draws
Upon successful review, CMHC issues a Certificate of Insurance. This is the official approval. The loan is finalized, and if it's a new build, construction draws can begin.
Completion & Final Attestations
After construction is complete, you must provide the final signed attestations from qualified professionals (e.g., an energy advisor or architect) to your lender. This must be done within 60 days of the final loan disbursement to confirm you've met your commitments.
7. Conclusion: Your Blueprint for a Successful Investment
The CMHC MLI Select program represents a fundamental shift in how multi-unit rental projects are financed in the GTA. It is a strategic tool where financial success is directly linked to achieving positive social and environmental outcomes. The days of treating affordability or accessibility as optional add-ons are over; under the new 2025 rules, they are the core drivers of profitability.
For new investors, the path to success is clear: engage in careful, early-stage planning. Model your project to achieve 100 points from day one. By strategically leveraging the long-term affordability commitment and baseline accessibility standards, you can unlock the program's maximum benefits—higher leverage, longer amortization, and lower premiums—creating a more resilient and profitable investment for your future.











%20Trans.png)
