
RSS

New property listed in Markham

I have listed a new property at 418 7167 Yonge Street in Markham. See details here

Welcome To This Well-Kept And Wonderfully Bright 1+Den Condo At World On Yonge. This Charming, Sun-Filled Home Features A Practical Open Concept Layout And Soaring 9-Foot Ceilings. Neat Laminate Flooring Runs Throughout The Spacious Unit Where The Versatile Den Easily Functions As A Second Bedroom Or A Home Office. The Practical Kitchen Offers Reliable Granite Countertops, A Ceramic Backsplash, And Stainless Steel Appliances. Step Out Onto Either Of Your Two Balconies To Take In Clean, Unobstructed South-Facing Views. The Comfortable Primary Bedroom Features A Generous Walk-In Closet For Plentiful Storage. Enjoy Exceptional Daily Convenience With Direct Indoor Access To The Shops On Yonge, Grocery Stores, And Medical Offices. Great Building Amenities Include A 24-Hour Concierge, An Indoor Pool, A Gym, And A Party Room. Perfectly Located Steps From TTC And YRT/VIVA Routes With Direct Connections To Finch Subway Station. This Excellent Package Comes Complete With One Parking Space And A Large Locker. A Fantastic Opportunity In An Established, Convenient Community!
Read

Bank of Canada Holds at 2.25% Again: What the July 15 Decision Means for Buyers, Sellers and Owners (2026)

Posted on July 15, 2026 by Ali Bolourchi · ~7 min read

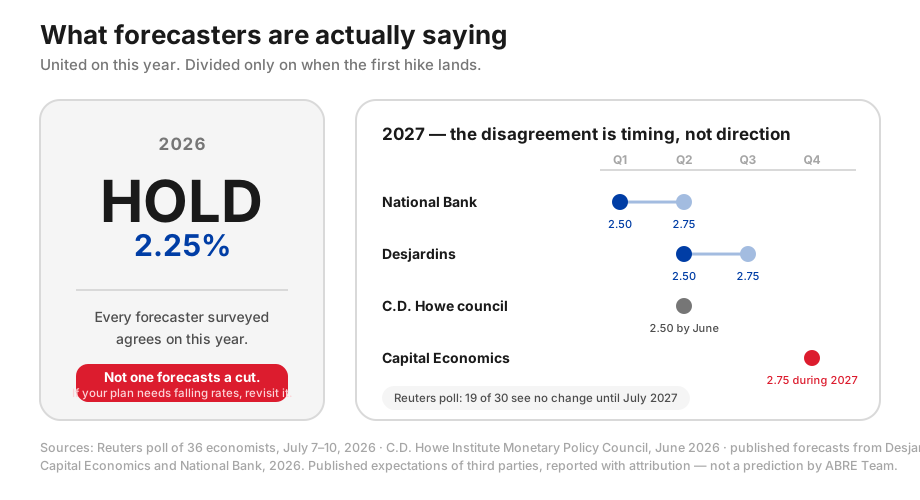
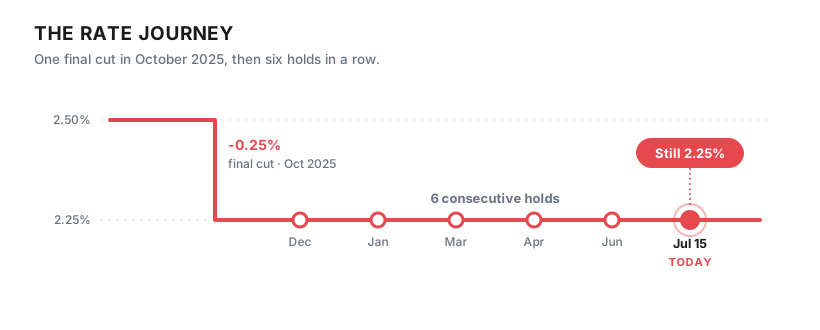
On July 15, 2026, the Bank of Canada did something that's starting to feel routine: nothing. It left the overnight rate unchanged at 2.25%, the sixth straight hold.

For anyone with a mortgage, a home to sell, or a purchase on the horizon, that "no news" is the news. It tells you where borrowing costs are headed for the rest of the year, and it clears out a lot of the uncertainty that has hung over the market for two years.

Here's what they decided, why, and what it actually means for you.

The decision in one line

The policy rate stays at 2.25%. That's the rate that sets the prime rate at the big banks, which drives variable mortgages, HELOCs, and most floating-rate debt.

When the Bank holds, your variable costs hold too. Nothing about your payment, pre-approval, or carrying costs changes because of this announcement.

The real story is the streak. One hold means little. The pattern tells you where we are in the cycle.

How we got here

Rewind to last year. Through 2024 and into 2025, the Bank ran an aggressive easing campaign, cutting rates to prop up a slowing economy. That campaign ended in October 2025, with a final quarter-point cut from 2.50% to 2.25%.

Since then, it has been pause mode: holds in December 2025, January, March, April, June, and now July. Six decisions, zero changes. The cutting cycle is over for now, and the Bank wants hard evidence before it moves again either way.

Why they held again

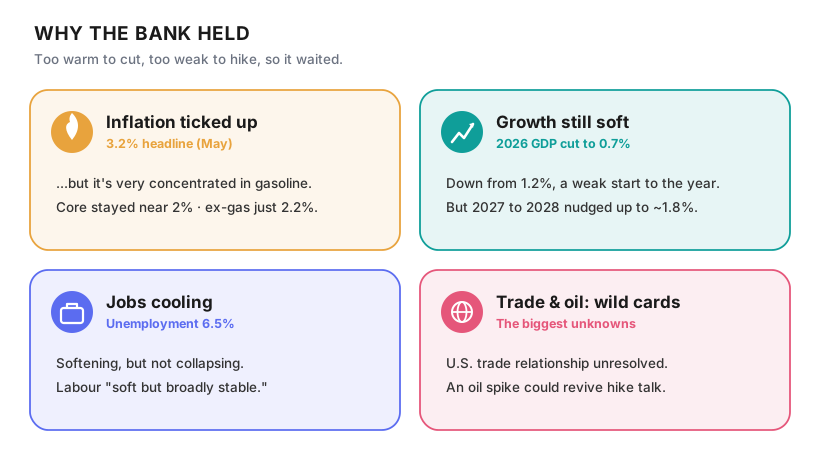
If the economy is soft, why not keep cutting? Because the Bank is boxed in between two opposing forces, and holding buys time while the picture clears.

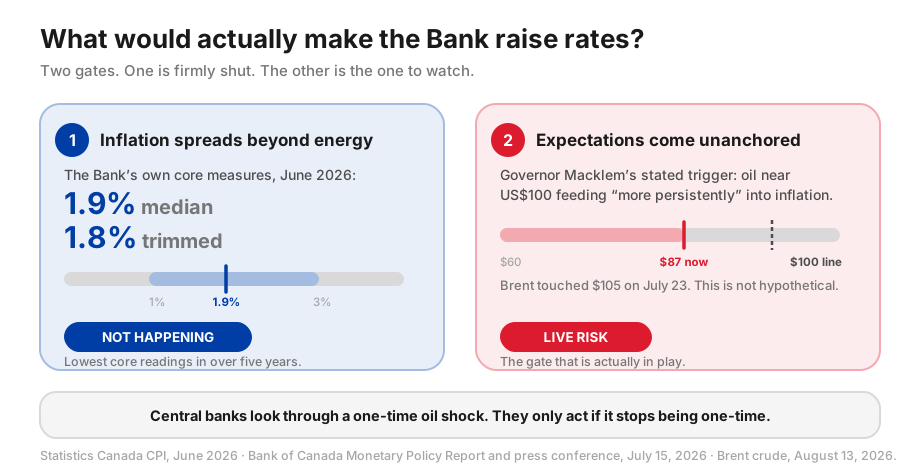
Inflation ticked up. Headline inflation hit 3.2% in May, just above the top of the 1% to 3% range. But Governor Tiff Macklem was blunt that the spike is narrow, not broad: "inflation is very concentrated in gasoline prices." Strip out gas and CPI was rising just 2.2%, while core stayed near 2%.

Growth is still soft, but stabilizing. The Bank cut its 2026 growth forecast to 0.7% (down from 1.2%), while nudging 2027 to 2028 up to about 1.8%. Sluggish now, better later, which takes the urgency out of cutting.

Jobs are cooling, not collapsing. Unemployment sits at 6.5%, and the Bank called labour conditions "soft but broadly stable." Softening usually argues for lower rates, but "stable" is the key word. There's no crisis forcing its hand.

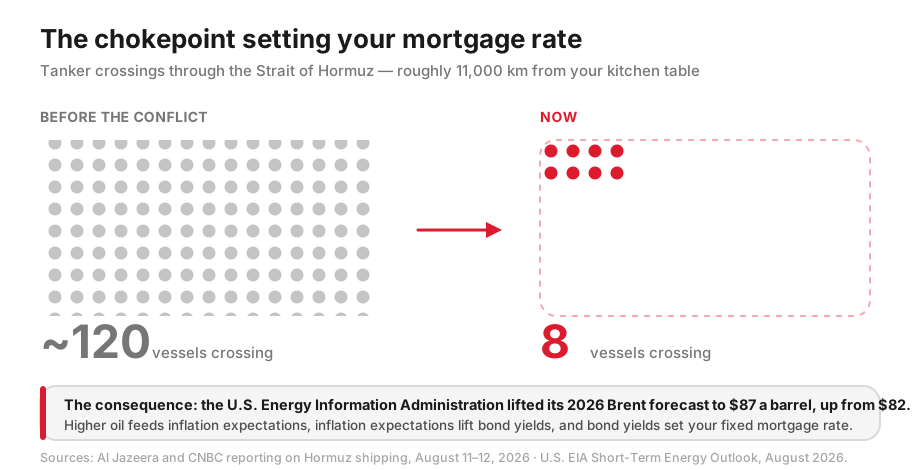
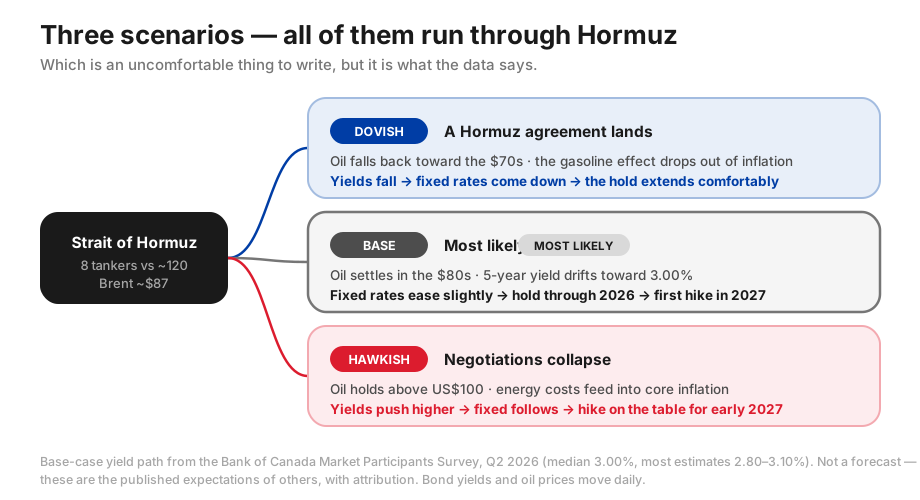
Trade and oil are the wild cards. The two biggest risks are the unresolved Canada and U.S. trade relationship and Middle East tension that could push oil higher. Macklem warned that "if oil prices go higher and stay higher," inflation risks would broaden, and he refused to rule out hikes if energy costs spike, though that is "not our base case."

The message in plain terms: too warm to cut, too weak to hike, too foggy to bet either way. So the Bank waits.

What it means for you

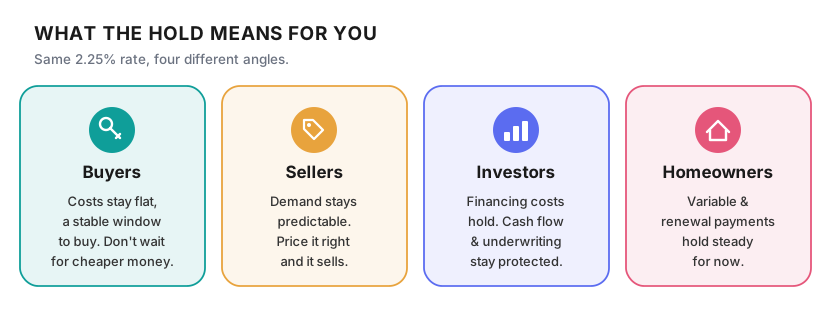
A hold isn't neutral. It lands differently depending on which side of the market you're on.

Buyers. Stability is your friend. Variable rates won't rise off this decision, and fixed rates (driven more by bond markets than the overnight rate) have settled into a predictable range. That's a stable window to shop, get pre-approved, and know your payment before you commit. The trade-off: don't wait around for dramatically cheaper money. With the Bank on a long pause, "holding out for lower rates" costs you time and pays for rising prices. If the numbers work today, they'll likely keep working.

Sellers. Predictable rates keep the buyer pool predictable. When costs stop lurching around, buyers regain confidence and commit, because they can budget with certainty. But this isn't an ultra-low-rate frenzy. Demand is steady, not red-hot, so pricing discipline matters. Well-presented, well-priced homes sell. Overpriced listings sit and go stale.

Investors. Flat financing costs are a gift for underwriting. With the Bank on an extended pause, you can model your payments with confidence, protect your cash-flow projections, and move on deals without fear of a surprise rate jump erasing your margin. Stable rates also keep cap rates steady, so you can compare opportunities on fundamentals instead of guessing where financing lands.

Homeowners. It depends on your mortgage. Variable-rate holders and anyone facing a renewal get steady payments for now, a welcome break after recent volatility. Fixed-rate holders see no change until renewal, and even then today's fixed rates are far easier to live with than the peaks of the tightening cycle. If your renewal is close, shop around rather than signing your lender's first offer, which is rarely their best one.

What to watch next

The next decision is September 2, 2026. Three things will shape it.

First, inflation. If the gas-driven spike fades and headline drifts back toward 2%, it cracks the door open for a future cut. Second, trade. Any shift in the Canada and U.S. relationship could move growth forecasts sharply. Third, oil. A sustained jump in energy prices is the one scenario that could genuinely put hikes back on the table, so watch the pumps.

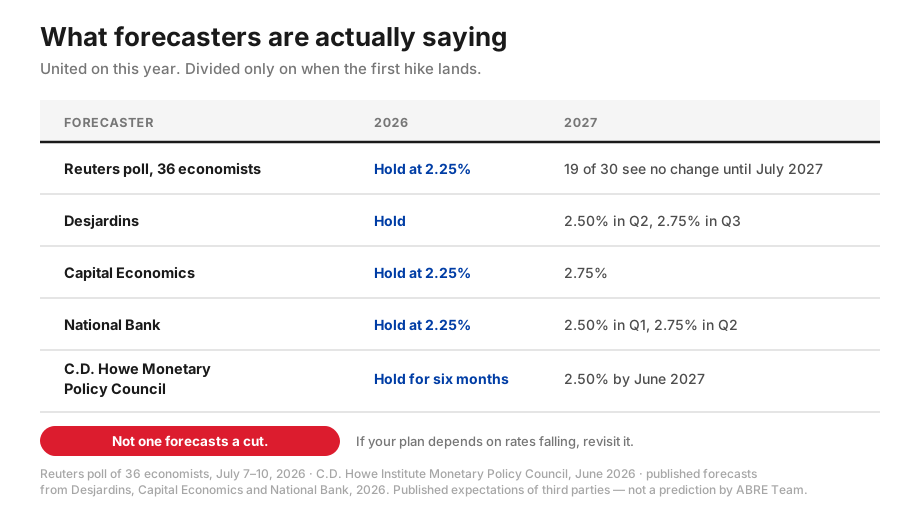
For now, the base case is more of the same. Most economists expect 2.25% to hold well into 2027, with any eventual move more likely a modest cut than a hike.

The bottom line

Six meetings in, the message is clear: we've entered a stretch of genuine rate stability. The big cuts are behind us, hikes are unlikely, and the Bank is content to watch and wait. For real estate, that's the most workable backdrop there is. Not the euphoria of falling rates, but the certainty that lets everyone plan.

Stability rewards action. If you've been on the sidelines waiting for a signal, this is it: the ground has stopped moving.

Before you make a move

Whether you're buying your first home, listing a property, adding to a portfolio, or facing a renewal, let's build a plan around numbers you can actually count on. No pressure and no upsell, just an honest read on what this market means for your situation.

Reach out anytime and we'll map out your next step.

Read

The 18-Day Difference: What Home Staging Actually Returns in Toronto (2026 Data)

Meta title: Home Staging ROI Toronto: 18 Days vs 31 Days (2026) Meta description: Staged Toronto listings averaged 18 days on market in Q1 2026 vs 31 unstaged. Here is the real cost, the defensible premium, and the order that works. Primary keyword: home staging ROI Toronto Reading time: about 6 minutes


The number that matters

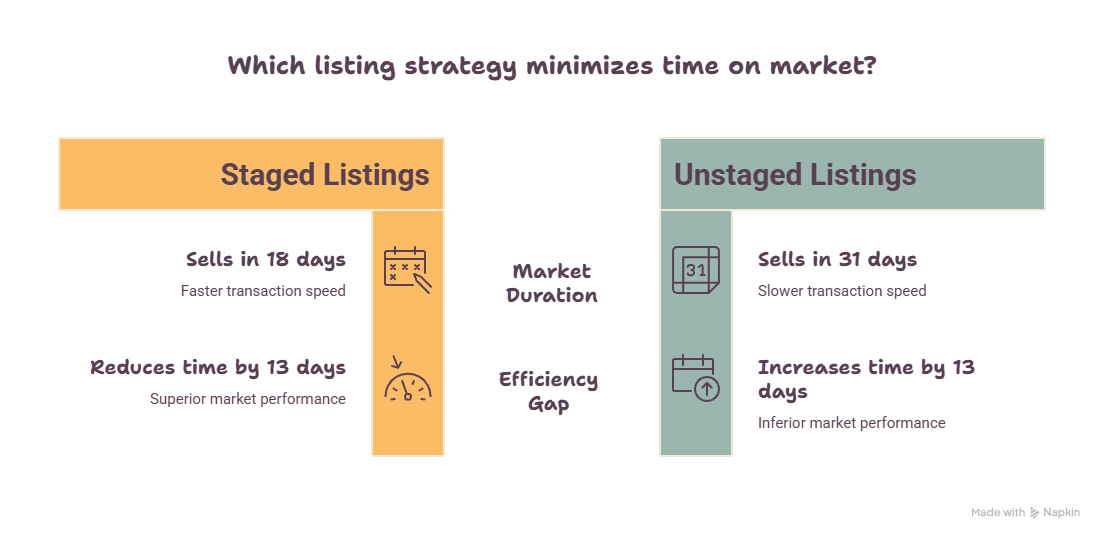
In Q1 2026, staged listings in Toronto averaged roughly 18 days on market. Comparable unstaged homes in the same submarkets averaged roughly 31 days.

That is a 13-day gap. Thirteen extra days of mortgage, tax, insurance, and utilities. Thirteen extra days of keeping the house showing-ready. And, more expensively, thirteen extra days for a listing to accumulate the one thing no seller wants: a days-on-market number that buyers read as weakness.

That last part is the real cost, and almost nobody prices it.


What staging actually costs in Toronto

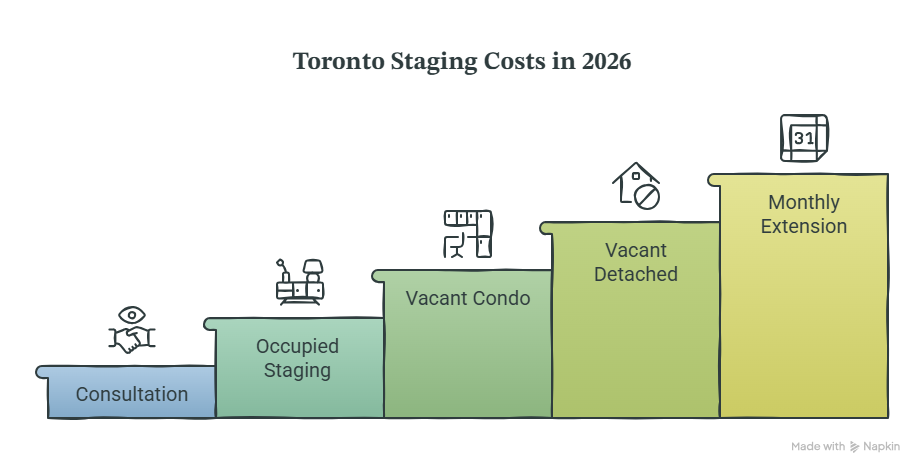
Before we talk about return, let us be honest about the number on the invoice. This is where most "staging pays for itself" content goes vague. Here are the real 2026 Toronto ranges.

Staging typeTypical Toronto cost (2026)Notes
Consultation only$150 to $500A walkthrough and a written punch list. You do the work.
Occupied staging$1,500 to $3,500You still live there. Stager edits and supplements your furniture.
Vacant condo or small homeFrom $2,000Full furniture package, smaller footprint.
Vacant detached, full package$5,000 to $10,000Multiple rooms, complete furniture rental.
Monthly extension fee$400 to $900 per monthMost contracts run 60 days. This is what it costs if you do not sell in the first cycle.

The line item sellers forget: the extension fee. A typical 2,200 square foot vacant detached might run $5,500 for the first 60 days, with a $700 per month extension after that. If your listing sits, the staging bill keeps growing alongside your carrying costs. Which is precisely why the days-on-market number in the first section is not a vanity metric.


Now the part everyone gets wrong: the ROI claim

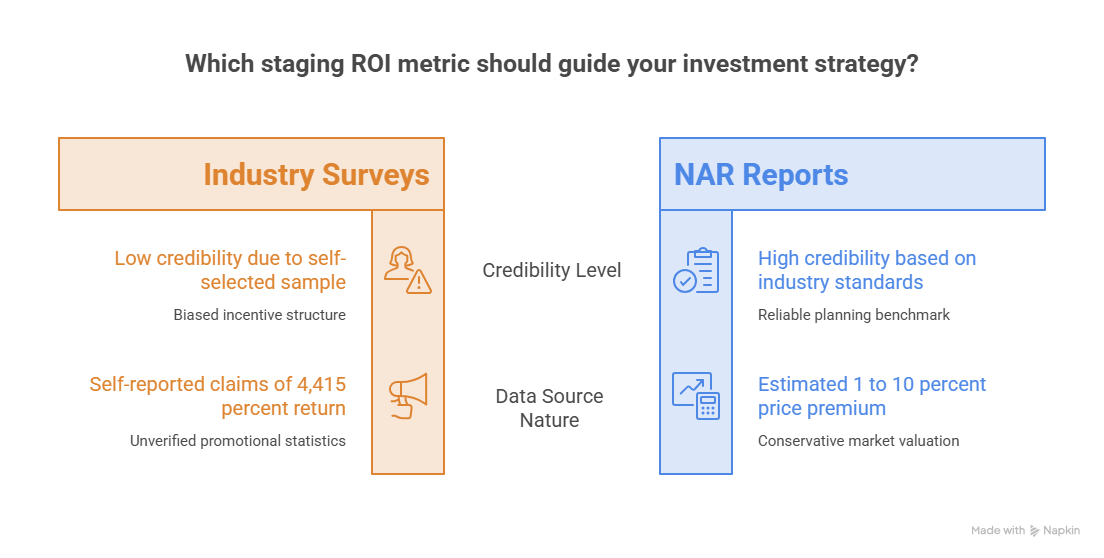
Search "home staging ROI" and you will be told staging returns $23.34 for every $1 invested, or that it delivers a 4,415% return.

Ignore both.

Those figures come from industry surveys where staging companies self-report their own results. It is not fraud, but it is not evidence either. It is a marketing number, and any seller making a five-figure decision deserves better than that.

The defensible benchmark is far more modest and far more useful:

SourceClaimed returnHow much weight to give it
Staging industry self-reported surveys$23.34 per $1 invested, up to 4,415% ROILow. Self-selected sample, no control group, obvious incentive.
NAR (National Association of Realtors)1% to 10% price premium over an unstaged equivalentHigh. This is your planning number.
Toronto Q1 2026 days-on-market data18 days staged vs 31 unstagedHigh. Directly observable, same submarkets.

Use the 1% to 10% band. On a $1.2M home, that is $12,000 to $120,000. Against a $5,500 staging bill, even the bottom of that range clears the cost more than twice over. You do not need the inflated number for the math to work. That is the point.


A worked example on a $1.2M Toronto home

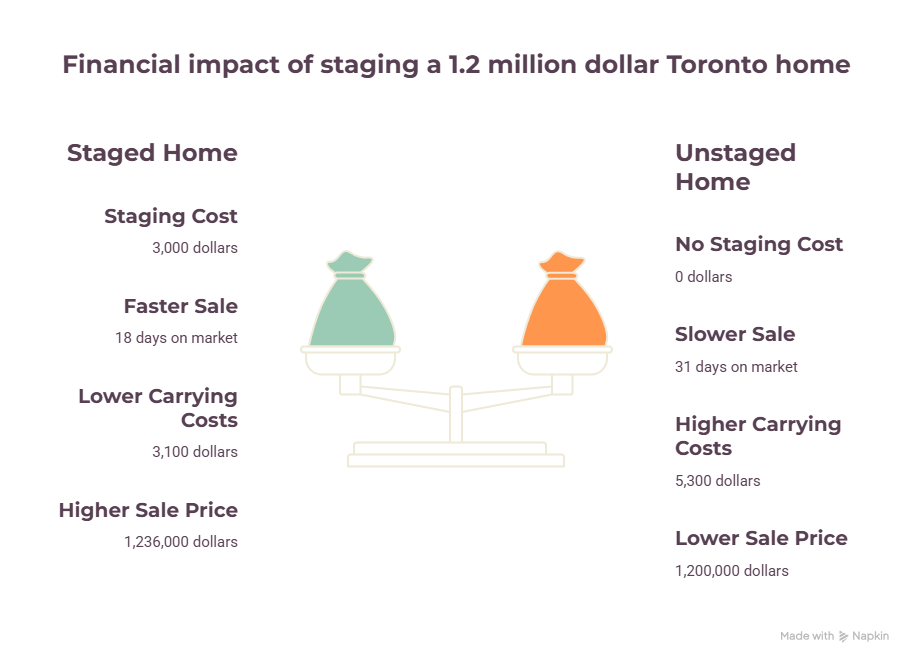
Let us put actual numbers on it. Assume a $1.2M detached, occupied, staged for $3,000, carrying costs of roughly $5,200 per month (mortgage, property tax, insurance, utilities).

StagedUnstaged
Staging cost$3,000$0
Days on market1831
Carrying cost while listedabout $3,100about $5,300
Sale price at a 3% premium$1,236,000$1,200,000
Net position$1,229,900$1,194,700
Difference+$35,200

Two things to notice.

First, the premium is doing most of the work, not the carrying-cost saving. The 13 fewer days saves you about $2,200. The 3% premium is worth $36,000. Speed is nice. Price is the prize.

Second, I used a 3% premium, which sits near the bottom of the defensible 1% to 10% band. I did that on purpose. If the case only works at the top of the range, it is not a case, it is a hope.


The order matters more than the budget

Here is the single most expensive mistake I see sellers make, and it costs nothing to fix.

They book the photographer first.

Photographs of a cluttered room are not a marketing asset. They are permanent evidence of a cluttered room, and they will follow the listing across every portal for as long as it is live.

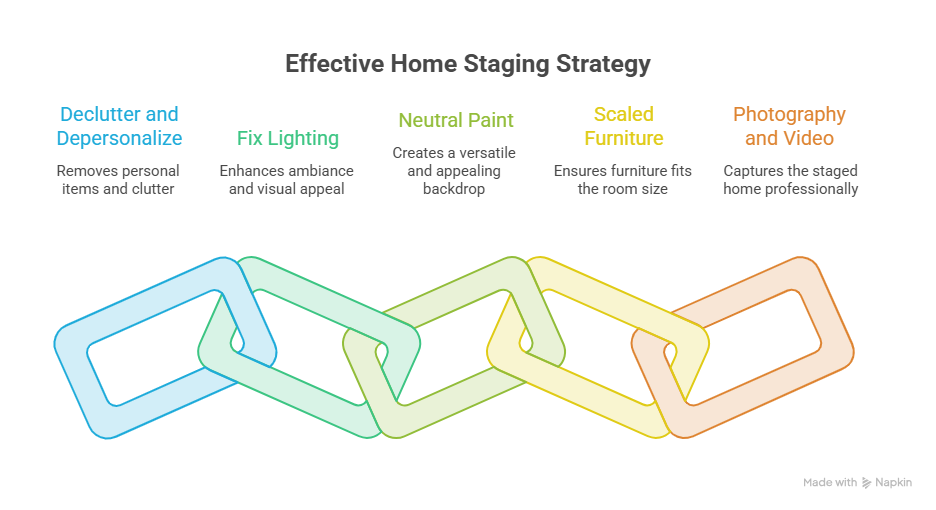
The sequence that actually produces the result:

StepWhat you doCostImpact
1Declutter and depersonalize. Boxes, closets, counters, fridge, family photos.$0 (plus storage)Highest. Biggest single lift, and it is free.
2Fix the lighting. Every bulb working, all bulbs the same warm temperature, every fixture on.Under $200High. Cheap and transformative on camera.
3Neutral paint, prioritized in the rooms that appear in the listing photos.$1,500 to $4,000High in the photographed rooms. Low elsewhere.
4Furniture scaled to the room, not to your life.Included in stagingMedium to high. This is what you hire a stager for.
5Photography, video, floor plans. Last.$500 to $1,500Multiplies steps 1 through 4. Multiplies zero by zero if you skip them.

Steps 1 and 2 cost almost nothing and deliver a disproportionate share of the outcome. If your budget is genuinely tight, do those two properly and skip the rest. That is a defensible plan. Booking the photographer on a cluttered house is not.


The honest summary

  • Staging is bought for time on market first, and for price premium second. Both are real.

  • The credible premium is 1% to 10%, not 4,000%. Plan on the low end and be pleased if you beat it.

  • Toronto staged listings averaged 18 days in Q1 2026 against 31 for unstaged comparables.

  • The sequence beats the budget. Declutter, light, paint, furnish, then photograph. Never the reverse.

  • Watch the extension fee. A listing that sits does not just cost you carrying costs. It keeps billing you for the staging too.


Before you spend a dollar

Every home is different, and some do not need staging at all. A well-proportioned, well-lit, recently renovated home with restrained furniture may only need a consultation and a weekend of decluttering.

The way to find out is to walk the house with someone who is not selling you furniture.

I will walk your home before you spend anything and tell you honestly which of the five steps you actually need. Some sellers walk away with a $200 plan. Some walk away with a $6,000 one. Both are the right answer for that house.


Sources

Kelly Allan Design, does home staging increase sale price, Toronto 2026 data: https://www.kellyallandesign.com/blog/does-home-staging-increase-sale-price-toronto/

Kelly Allan Design, home staging cost Toronto 2026 guide: https://www.kellyallandesign.com/blog/how-much-does-home-staging-cost-toronto/

StyleBite Staging, vacant home staging in Toronto, costs and ROI 2026: https://stylebitestaging.com/toronto-vacant-home-staging/

Real Estate Staging Association and NAR benchmarks, as summarized in the above

Figures are current as of July 2026 and reflect Toronto and GTA submarkets. Individual results vary by property, price band, and condition. This article is educational and is not financial advice.

Read

TRREB called 2026 a “year of two halves.”

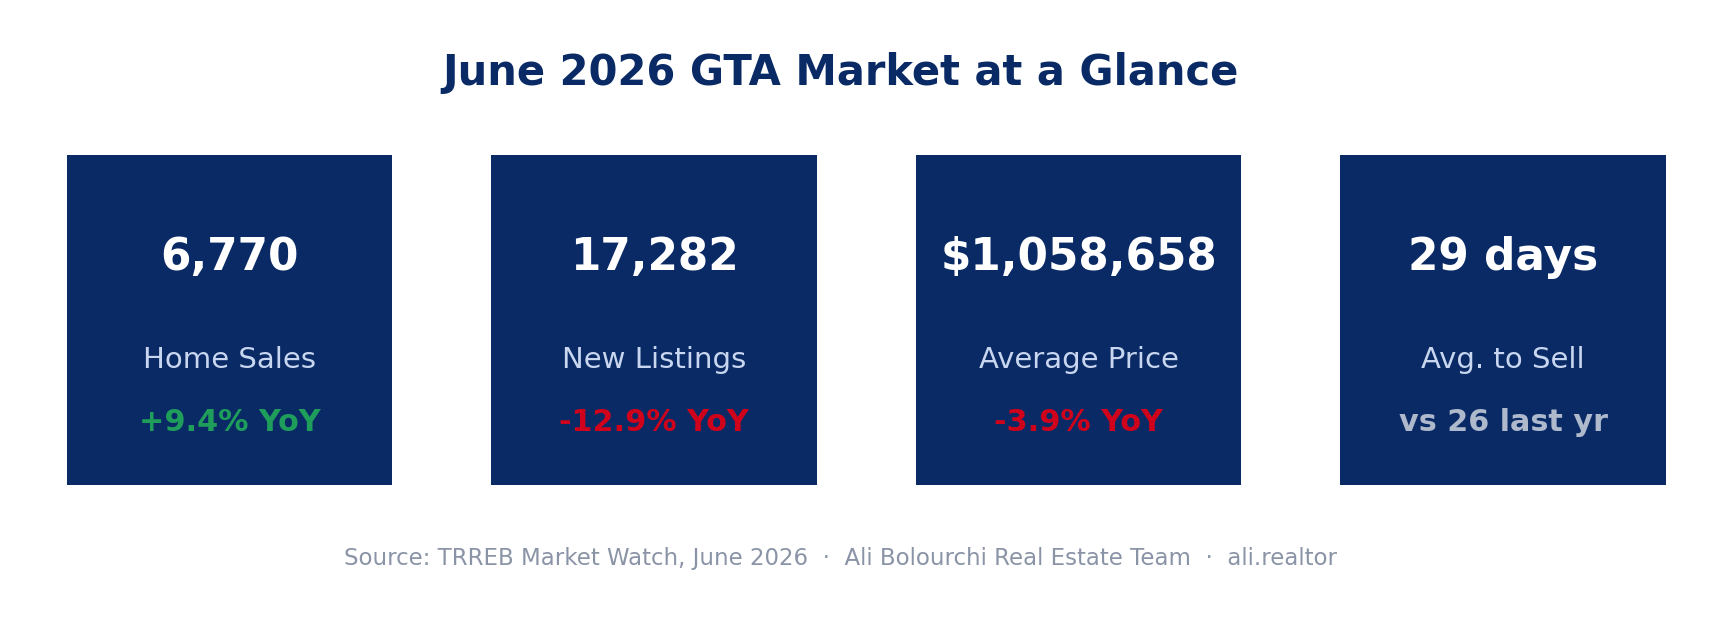
June is the month the second half showed up early. Sales surged 9.4% year-over-year — the strongest annual gain of the cycle — while new listings fell another 12.9% and the pace of price declines kept shrinking. The turn is no longer a forecast. It is in the data.

According to the latest TRREB Market Watch (released July 3, 2026), the GTA recorded 6,770 home sales in June 2026, up 9.4% year-over-year, while new listings fell 12.9% to 17,282. Active inventory is down as well — 27,329 active listings, a 13.5% year-over-year drop. On a seasonally adjusted, month-over-month basis, June sales rose versus May while new listings fell, and both the average selling price and the MLS® HPI Composite ticked up. When demand climbs and supply retreats at the same time, this is exactly the print you expect.

The price story is the one to watch. The average selling price came in at $1,058,658, down just 3.9% year-over-year — a materially smaller decline than the 6%-plus gaps we were reading earlier in the year. The MLS® HPI Composite benchmark was down 5.4%. As TRREB’s Chief Information Officer put it, “the annual rate of decline has receded over the past few months” and, if tightening continues, selling prices could move in line with 2025 and eventually post increases. Translation: the floor is forming in real time. Here is exactly where the market stands by property type — and what every buyer, seller, and investor should do about it.

June 2026 GTA market at a glance

Sales climbing while supply and price retreat — the tightening in one picture


Detached Homes

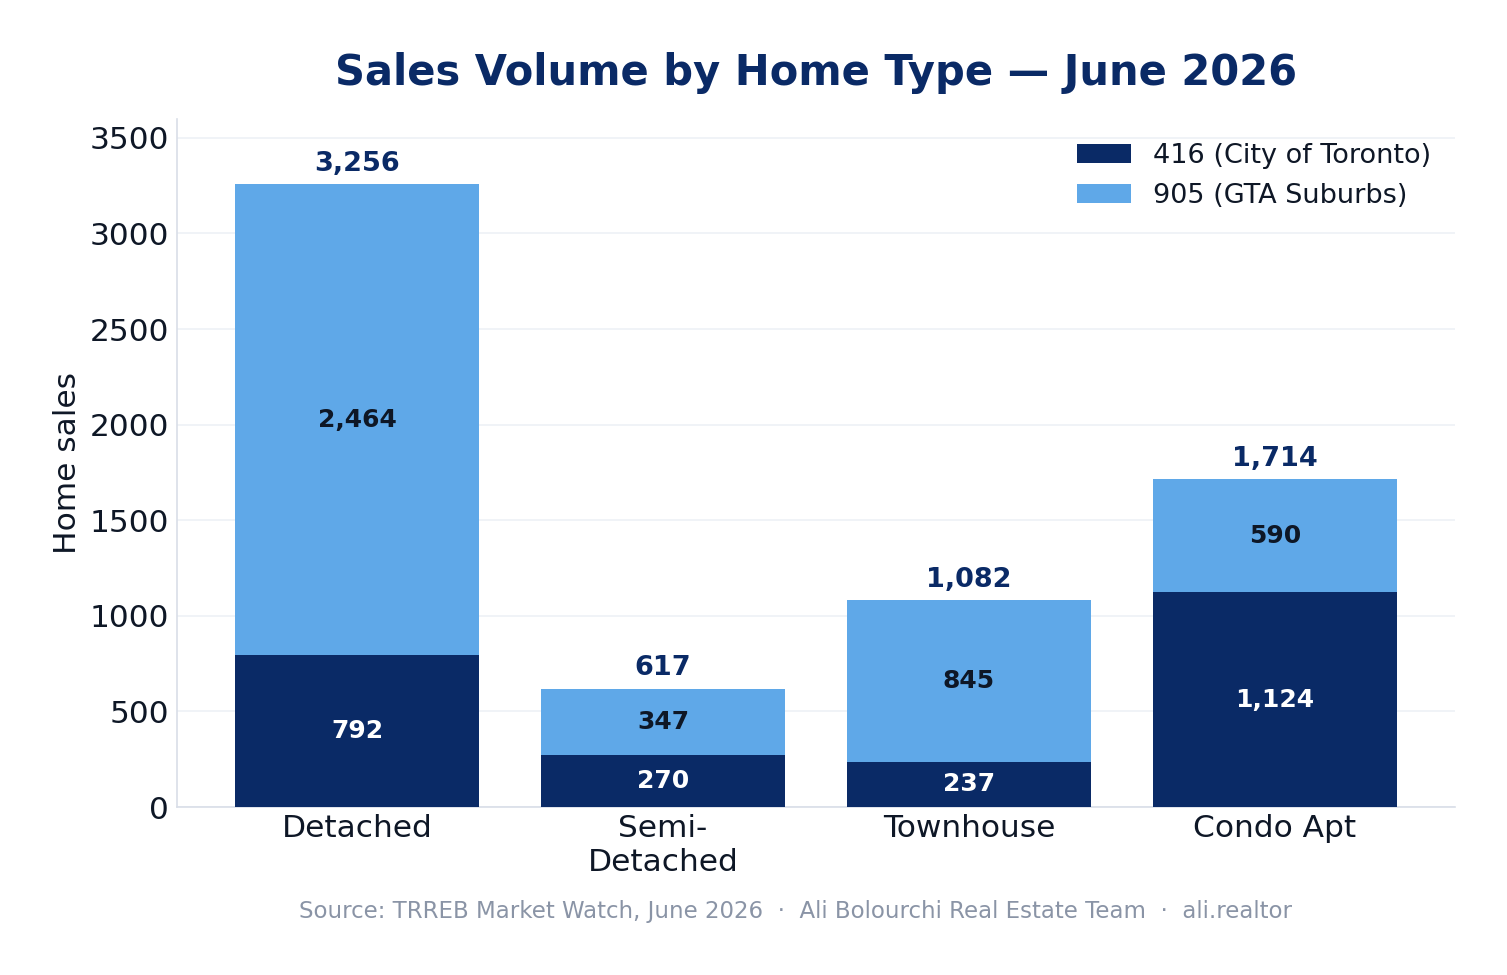
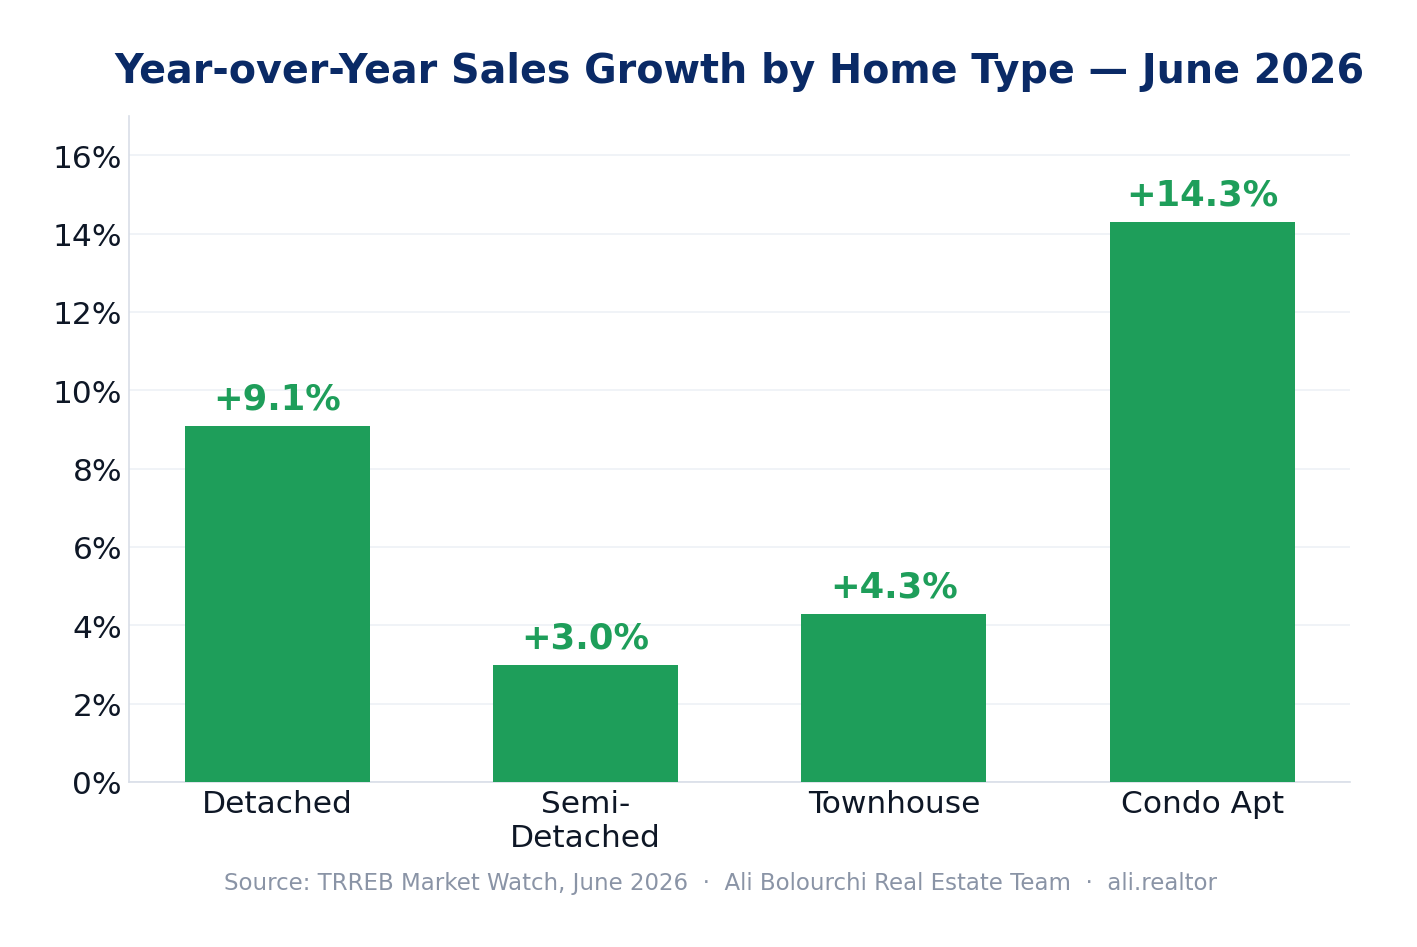
Detached homes led the market again, posting 3,256 sales — 48% of all GTA transactions and a 9.1% year-over-year sales gain. Demand for the region’s benchmark asset class is broad and accelerating, and it is happening while detached prices sit essentially flat to modestly lower than 2025. Improved affordability from lower borrowing costs is pulling buyers back into the segment at scale.

  • 416 (City of Toronto)

    • Sales: 792 transactions in June 2026 (up 0.4% year-over-year).

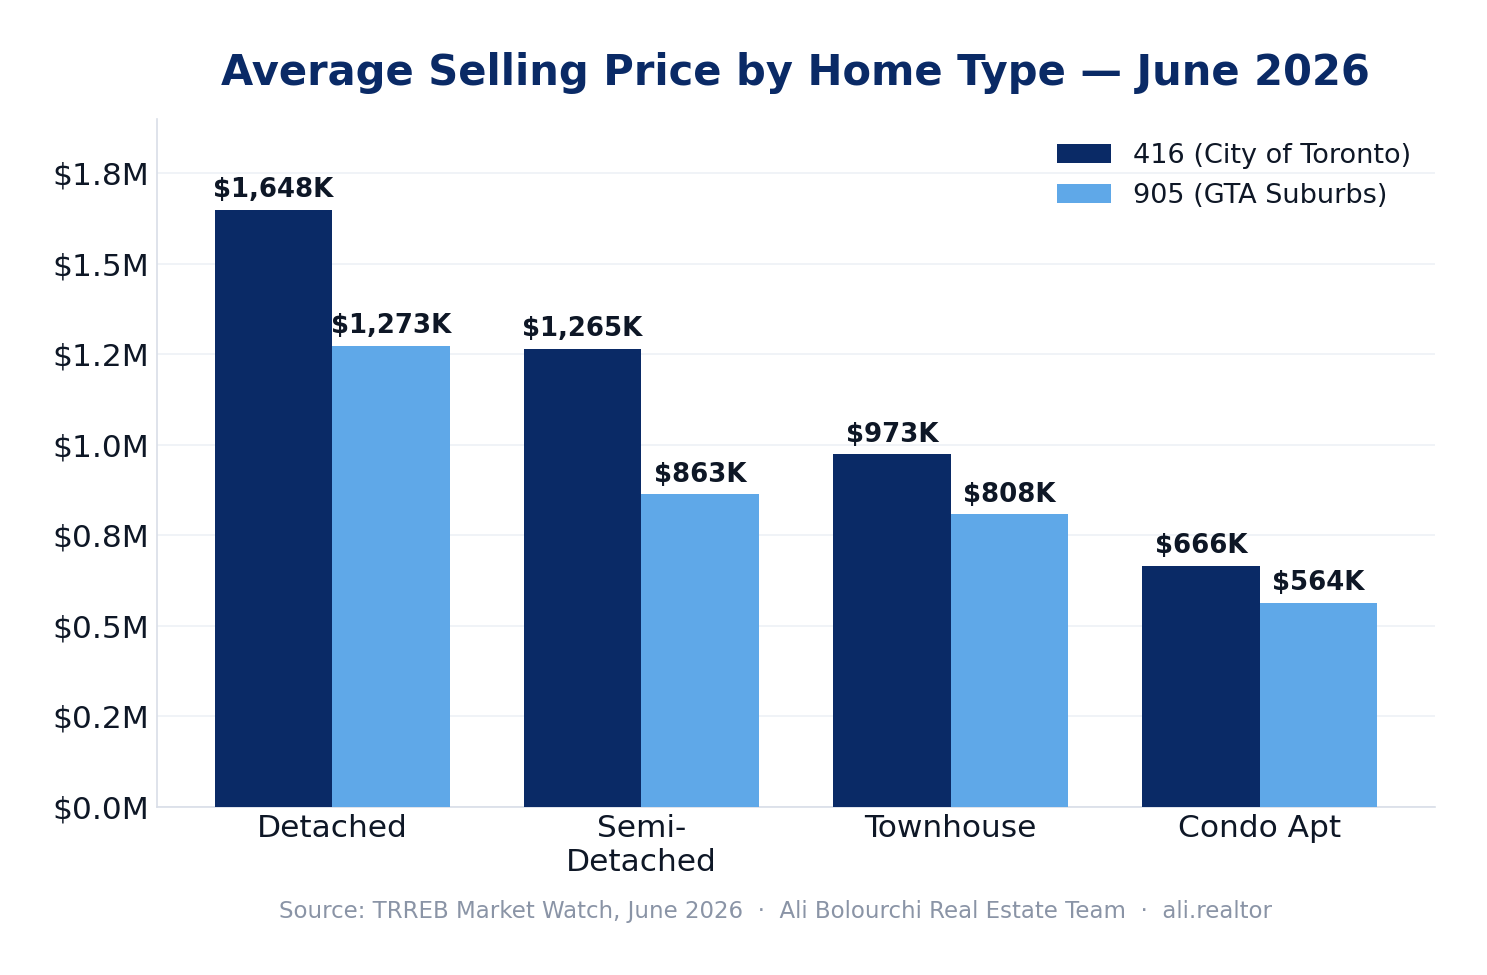
    • Average Price: $1,648,440 — up 0.3% year-over-year.

    • Trend: City detached is one of only two segments in the entire report with a positive year-over-year price move. Prices holding above last year while sales rise is a clear tightening signal.

  • 905 (GTA Suburbs)

    • Sales: 2,464 transactions in June 2026 (up a strong 12.3% year-over-year).

    • Average Price: $1,272,842 (down just 2.2% year-over-year).

    • Trend: The suburbs are the volume engine. Double-digit sales growth paired with a price decline of only 2.2% means 905 detached has effectively found its floor — and buyers are competing for it.

Insight: The 905 detached number is the tell this month — 12.3% sales growth against a 2.2% price dip is a market absorbing inventory fast. For sellers who held off through 2025, listing into a market with 12.9% fewer competing listings is the strongest case in the cycle. For buyers, the “wait for a deeper correction” thesis has run out of runway.

Where the volume is: sales by home type, 416 vs 905


Semi-Detached Homes

Semi-detached homes — the “missing middle” that structurally cannot be replaced — produced 617 sales in June, up 3.0% year-over-year. The 416 held its price within roughly a point of last year, while the 905 kept posting the sales growth.

  • 416 (City of Toronto)

    • Sales: 270 transactions in June 2026 (down 3.2% year-over-year).

    • Average Price: $1,264,782 (down just 1.1% year-over-year).

    • Trend: Among the most price-stable segments in the GTA. A softer sales count here is a supply story, not a demand story — owners are holding these scarce city semis.

  • 905 (GTA Suburbs)

    • Sales: 347 transactions in June 2026 (up 8.4% year-over-year).

    • Average Price: $863,272 (down 6.7% year-over-year).

    • Trend: The value play for move-up buyers. Suburban semis under $875K remain one of the best freehold entry points in the region, and sales are responding.

Insight: A 416 semi holding within 1.1% of last year’s price while the broader market is down 3.9% is the scarcity premium reasserting itself. Move-up buyers who want freehold ownership in the city without the detached price tag should act here first. For 905 sellers, the buyers are showing up at the right price — pricing discipline is what converts them.


Townhouses

Townhouses recorded 1,082 sales in June 2026, up 4.3% year-over-year, and continue to attract the widest buyer demographic — young families, downsizers, and first-time buyers chasing ground-level living without a detached price tag.

  • 416 (City of Toronto)

    • Sales: 237 transactions in June 2026 (down a marginal 0.4% year-over-year).

    • Average Price: $973,232 — up 1.5% year-over-year.

    • Trend: The second segment in the report with positive year-over-year price growth. Well-located city townhouses are scarce, and that scarcity is now showing up in price.

  • 905 (GTA Suburbs)

    • Sales: 845 transactions in June 2026 (up 5.8% year-over-year).

    • Average Price: $808,495 (down 4.4% year-over-year).

    • Trend: The volume engine of the segment — accessible price points and steady sales growth as families choose the space-to-price ratio.

Insight: A 416 townhouse price up 1.5% year-over-year, while the region is still slightly negative, tells you where the competition is concentrating. If you own a properly located Toronto townhouse — Leslieville, The Junction, Roncesvalles, Riverdale — you are listing into a market starved for your product. List with discipline; the buyers are waiting.

Average selling price by home type — the 416 premium at a glance


Condo Apartments

The condo apartment segment was the sales surprise of the month, posting 1,714 sales — up roughly 14% year-over-year and 25% of all GTA transactions. With an average price of $630,688, condos remain the most accessible entry point into GTA homeownership, and after multiple quarters of correction, buyers are moving decisively against the value.

  • 416 (City of Toronto)

    • Sales: 1,124 transactions in June 2026 (up sharply, ~14% year-over-year).

    • Average Price: $665,760 (down 9.0% year-over-year).

    • Trend: The downtown and waterfront reset continues to convert into transactions. Steady, durable demand at meaningfully lower entry pricing.

  • 905 (GTA Suburbs)

    • Sales: 590 transactions in June 2026 (up sharply, ~14% year-over-year).

    • Average Price: $563,874 (down 10.6% year-over-year — the steepest price decline in the report).

    • Trend: Sub-$575K suburban product is being absorbed by first-time buyers priced out of freehold.

Insight: Condo sales jumping ~14% while prices are still down 9–11% year-over-year is the textbook bottom-formation pattern — rising volume meeting falling price is how a floor gets built. With the Bank of Canada at 2.3%, condo prices well off their 2022 peak, and new-listing supply contracting region-wide, this is the alignment professional investors wait for. If you are positioning a condo for a 3-to-5-year horizon, the entry window is closing in real time.

Every property type is up year-over-year — condos leading the charge


Pace of the Market

Homes are still giving buyers a moment to think — but the clock is speeding up. The average property took 29 days to sell (list date to sale date) in June, up from 26 days a year ago, while the average time on market across a full listing cycle held at 42 days. Read alongside a sales-to-new-listings ratio that has climbed to roughly 39% (6,770 sales against 17,282 new listings), the direction is unambiguous: fewer homes are coming to market, and the ones that do are being absorbed faster than last year.


Economic Backdrop

The macro picture continues to support the shift. The Bank of Canada’s overnight rate is holding at 2.3%, with prime at 4.5%. Mortgage rates sit at 5.49% (one-year), 6.05% (three-year), and 6.09% (five-year). Inflation is running at 3.2% (May CPI), and Toronto employment grew 0.7% in May — though the Toronto unemployment rate remains elevated at 7.6% and real GDP was essentially flat in Q1 (-0.1% annualized). Those crosscurrents are exactly why some would-be sellers stayed on the sidelines — and why new listings have fallen faster than sales.

TRREB President Daniel Steinfeld framed the year directly: “After a slow start in the first quarter, we saw a marked improvement in home sales in the second quarter of this year. This result followed TRREB’s 2026 outlook, which called for a year of two halves. We expect accelerating transactions and more competition between buyers in the last six months of the year, helping to satisfy pent-up demand and ultimately resulting in renewed price growth.”

Chief Information Officer Jason Mercer added: “While the average selling price was still down year-over-year in June, the annual rate of decline has receded over the past few months. If market conditions continue to tighten in the second half of 2026, selling prices could move in line with 2025 and eventually post some increases. This would give an increasing number of households the confidence to move back into the marketplace.” The signal for buyers reading this today: a market that is already tightening is expected to tighten further — with renewed price growth openly on the table.


What This Means for You

If You Are a Buyer: The window of maximum leverage is narrowing faster than it was a month ago. Sales are up 9.4% year-over-year, new listings are down 12.9%, active inventory is down 13.5%, and prices rose month-over-month on a seasonally adjusted basis. The rate of annual price decline has shrunk to 3.9%, and TRREB is openly discussing price growth. The combination of prices still below 2025, a Bank of Canada at 2.3%, and a genuine supply squeeze does not last. If you have been waiting for confirmation that the bottom is in, this report is it — and the cost of waiting another quarter is now measurable.

If You Are a Seller: You are in the strongest position you have held since 2022. New listings are down 12.9% year-over-year and active inventory is down 13.5% — well-priced, well-presented homes are facing dramatically less competition than a year ago, and they are selling three days faster. City detached and city townhouses are already posting positive year-over-year price growth. If you have been deferring a listing decision, the second-half window is open right now. Buyers are still informed, so pricing discipline matters — but the leverage has clearly shifted toward you.

If You Are an Investor: Condo apartments posting ~14% sales growth at 9–11% lower year-over-year pricing is textbook bottom-formation. Rates are accommodative, structural housing supply remains constrained, and GTA rental demand fundamentals are robust. For 3-to-5-year horizons, this is the entry environment professional investors wait years for. Move with discipline — but move.


Ready to Act on This Market?

Whether you are buying your first home, executing a strategic move-up, listing a property you have held for years, or building an investment portfolio — the June 2026 data is unambiguous. The second half has arrived early, and the supply squeeze is accelerating it. The only question is what you do with that information.

I work with buyers, sellers, and investors across the GTA — from first-time purchases to complex multi-property transactions — and I am here to help you navigate this market with precision and confidence. Let’s talk about exactly what this data means for your situation, your timeline, and your numbers.

Read

The 2026 Mortgage Renewal Masterclass: A Step-by-Step Blueprint for GTA Homeowners & Investors

The Canadian real estate landscape is experiencing its most critical milestone yet. For over 1.2 million households navigating the historic 2026 Mortgage Cliff, renewing a loan is no longer a simple paperwork exercise. Moving from pandemic-era rates under 2% into today's restructured market requires clear data and a methodical approach.

Instead of facing this transition with anxiety, we can view it as a design problem to be solved with logic. This definitive guide outlines the step-by-step process of securing your equity, dissects the modern mechanics of Fixed vs. Variable rates, and highlights what you must look for before signing your name.

Step 1: The Timeline — Plotting Your Market Entry

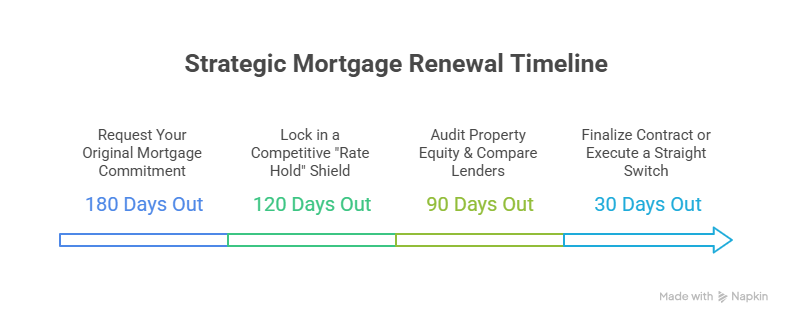
Lenders rely on the "convenience trap." By law, banks are only required to send your renewal notice 21 days before your maturity date. They expect you to panic and sign their baseline offer. To protect your net wealth, your timeline must begin much earlier.

  • 180 Days Out: Request a copy of your original mortgage commitment letter from your current lender. You need to identify how your mortgage was registered (Standard vs. Collateral Charge).

  • 120 Days Out: Secure a formal Rate Hold with an independent broker or alternative lender. This acts as a free financial option, locking in a ceiling to protect your household budget against bond market spikes while letting you float down if rates drop before your maturity date.

Step 2: Choose Your Engine — Fixed vs. Variable Rate Mechanics

The single most critical choice you will make is how your loan behaves over the next term. In today's market, the gap between these two options involves different pricing engines and distinct structural risks.

The 2026 Rate Landscape

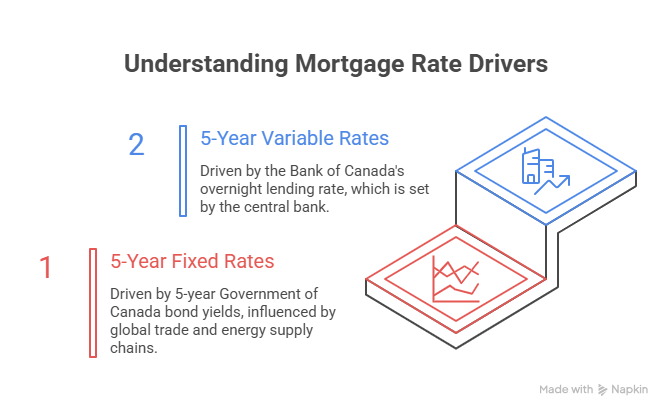
  • 5-Year Fixed Rates (~3.84% – 4.04%): Driven directly by 5-year Government of Canada bond yields, which have experienced volatility due to global trade tariffs and energy supply chain adjustments.

  • 5-Year Variable Rates (~3.30% – 3.35%): Driven directly by the Bank of Canada's overnight lending policy rate (sitting at 2.25%).

To determine which path suits your lifestyle narrative, evaluate the pros, cons, and financial trade-offs of each structure:

1. Fixed-Rate Mortgages

The Strategy: Your interest rate and monthly payment remain entirely locked for the duration of your term (e.g., 3 or 5 years).

  • The Pros: Complete psychological peace of mind. Your budget is entirely shielded from sudden inflation shocks or international market movements.

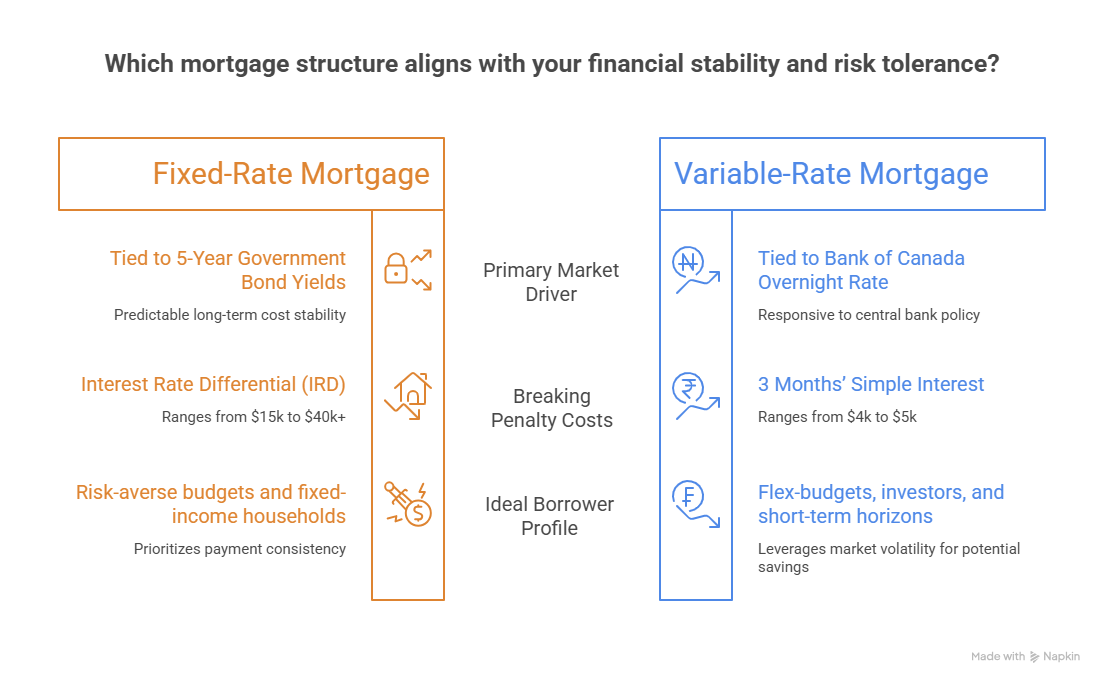
  • The Cons: Total structural rigidity. If the Bank of Canada cuts rates further, you are trapped at your higher rate. Most importantly, if you need to sell your property or refinance mid-term, the bank calculates your penalty using the Interest Rate Differential (IRD), which frequently leads to five-figure penalties.

2. Variable-Rate Mortgages (VRM vs. ARM)

The Strategy: Your interest rate fluctuates based on lender prime rates, which move in tandem with the Bank of Canada.

  • The Pros: Historically, variable rates tend to cost less over the lifetime of a standard loan. Right now, variable rates offer a notable discount compared to fixed options. Breaking a variable mortgage carries a transparent, predictable penalty capped at just 3 months' simple interest.

  • The Cons: If domestic inflation experiences a sudden uptick, your borrowing costs will climb. You must ensure you have the financial flexibility to manage fluctuating interest environments.

Structural Comparison Matrix

Step 3: Look Out for the Hidden Details

Beyond the headline interest rate, a mortgage is a legal structure that can either grant you long-term freedom or restrict your options. Here are three critical details you must look out for:

1. The VRM vs. ARM "Trigger Rate" Blueprint

If you opt for a variable rate, look at how the payment handles changes. An Adjustable-Rate Mortgage (ARM) shifts your payment automatically as prime changes, keeping your amortization on schedule. A Variable-Rate Mortgage (VRM) keeps your monthly payment identical, but shifts how much of that money goes to principal vs. interest.

  • What to look out for: If rates rise, a VRM can hit its Trigger Rate—the point where your payment fails to cover the basic interest. Lenders will then require an immediate lump-sum payment or trigger negative amortization, where your debt grows every month.

2. Standard Charges vs. Collateral Charges

Look at your original registration documentation. A Standard Charge registers the exact amount you owe. A Collateral Charge allows big banks to register up to 125% of your home's total value on title.

  • What to look out for: While collateral charges make borrowing extra equity simpler, they cannot be transferred to a competitor seamlessly at renewal. Moving them requires $600 to $1,000 in legal title re-registration fees, reducing your negotiating leverage.

3. The New OSFI "Straight-Switch" Rule

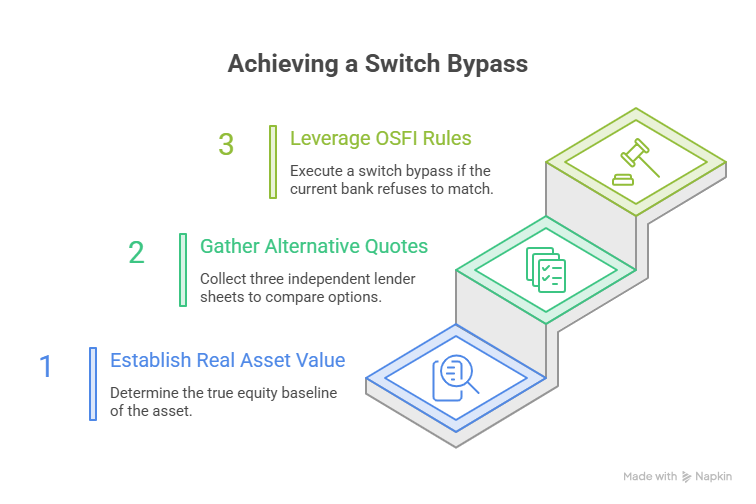
The financial regulator updated guidelines to give Canadian consumers more freedom. If you execute a "straight switch"—meaning your remaining balance and amortization period stay completely identical—you no longer have to pass the formal mortgage stress test to change lenders.

  • What to look out for: Banks often hide this fact. If a competing lender offers a lower rate, you can move your mortgage over without the old "Contract Rate + 2%" qualifying hurdle.

Step 4: The Execution — Your Path to Leverage

To successfully negotiate with your current bank or prepare for a straight switch to a competitor, you must first understand your true asset value. Your home equity is your ultimate leverage. If you don't know the exact current value of your property in the current GTA market, you are negotiating in the dark.

Instead of letting institutional timelines dictate your choices, take control of your financial position before it becomes an issue. Establishing your real-world equity baseline provides the precise data you need to make an informed, confident decision.

To discover where your property stands in today's landscape and secure the clarity required to negotiate with confidence, access our digital evaluation platform:

👉 Secure Your Free Strategic Property Evaluation

Read

The Bank of Canada Just Hit Pause Again. Here's What the Governor Said That Actually Matters.

The Bank of Canada held its overnight rate at 2.25% today — the fifth hold in a row. That part wasn't a surprise. What deserves your attention is what Governor Tiff Macklem said after the decision, because it tells you more about where rates are headed than the hold itself.

If you're planning to buy, sell, refinance, or renew in the next twelve months, this is the conversation that affects your timing. Let me break it down.


Why They Held: The Stagflation Trap

Canada is stuck in a situation economists call stagflation — a weak economy and rising inflation showing up at the same time. The bright spot is that core inflation, which strips out volatile items like energy and food, has actually been improving.

But here's why the combination is so difficult: these two problems almost never appear together.

A weak economy usually keeps prices low. Rising prices usually come with a strong economy. When both hit at once, the Bank loses its easy playbook — and every move carries a cost.

The dilemma in plain terms:

  • If they raise rates to fight inflation → they risk pushing an already fragile economy further into the ground. More unemployment. Less consumer spending. A deeper slowdown.

  • If they cut rates to support growth → they risk making inflation worse. More money in the system, higher prices, and an inflation problem that becomes far harder to reverse.

So they're holding — and watching closely instead.

As Governor Macklem put it today: "Uncertainty is unusually elevated, and the risks could shift. Monetary policy may need to be nimble."

That's central-bank language for: we genuinely don't know yet. And when the people setting the rate are openly uncertain, the worst thing you can do is freeze. The people who win in markets like this aren't the ones who guess the bottom — they're the ones who have a plan for either direction.


The Inflation Picture Is More Complicated Than the Headlines

Inflation is the other half of the problem, and the headline number hides what's really going on.

The headline: Canada's Consumer Price Index (CPI) rose 2.8% year-over-year in April — above the Bank's 2% target and up from 2.4% in March. The Bank now expects inflation to hover near 3% in the coming months before gradually easing back toward 2%.

Why is it up? Almost entirely gasoline. Gas prices jumped nearly 29% year-over-year in April, driven by the war in the Middle East disrupting global oil supply and shipping routes. Strip gasoline out of the equation, and inflation sits right at 2% — exactly on target.

Is it spreading? Not yet — and this is the single most important thing the Bank is watching. Core inflation measures actually moved down in April, to around 2%. The share of products and services with prices rising above 3% is near its historical average. The Bank sees "limited evidence of broad-based pass-through of higher energy prices to other consumer prices."

In plain terms: the gas spike hasn't started inflating the cost of your groceries, your haircut, or your rent. That's reassuring — but the Bank knows it can change fast if the war drags on.


How Canada Stacks Up Against the U.S.

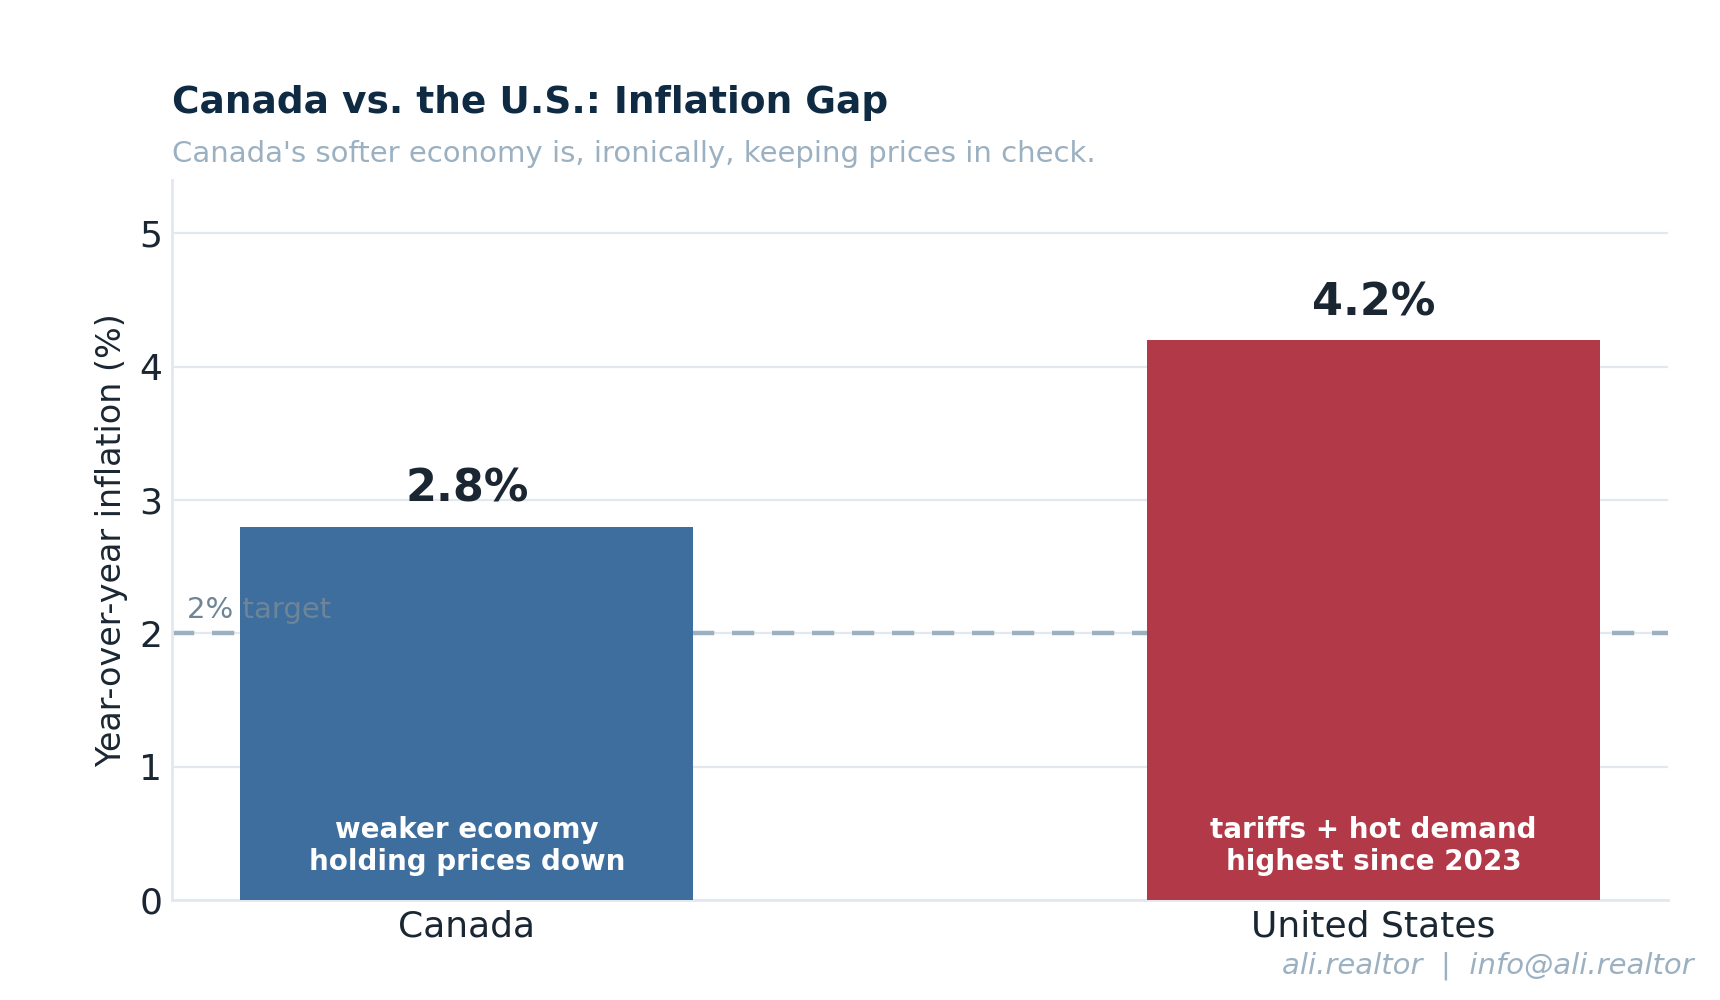
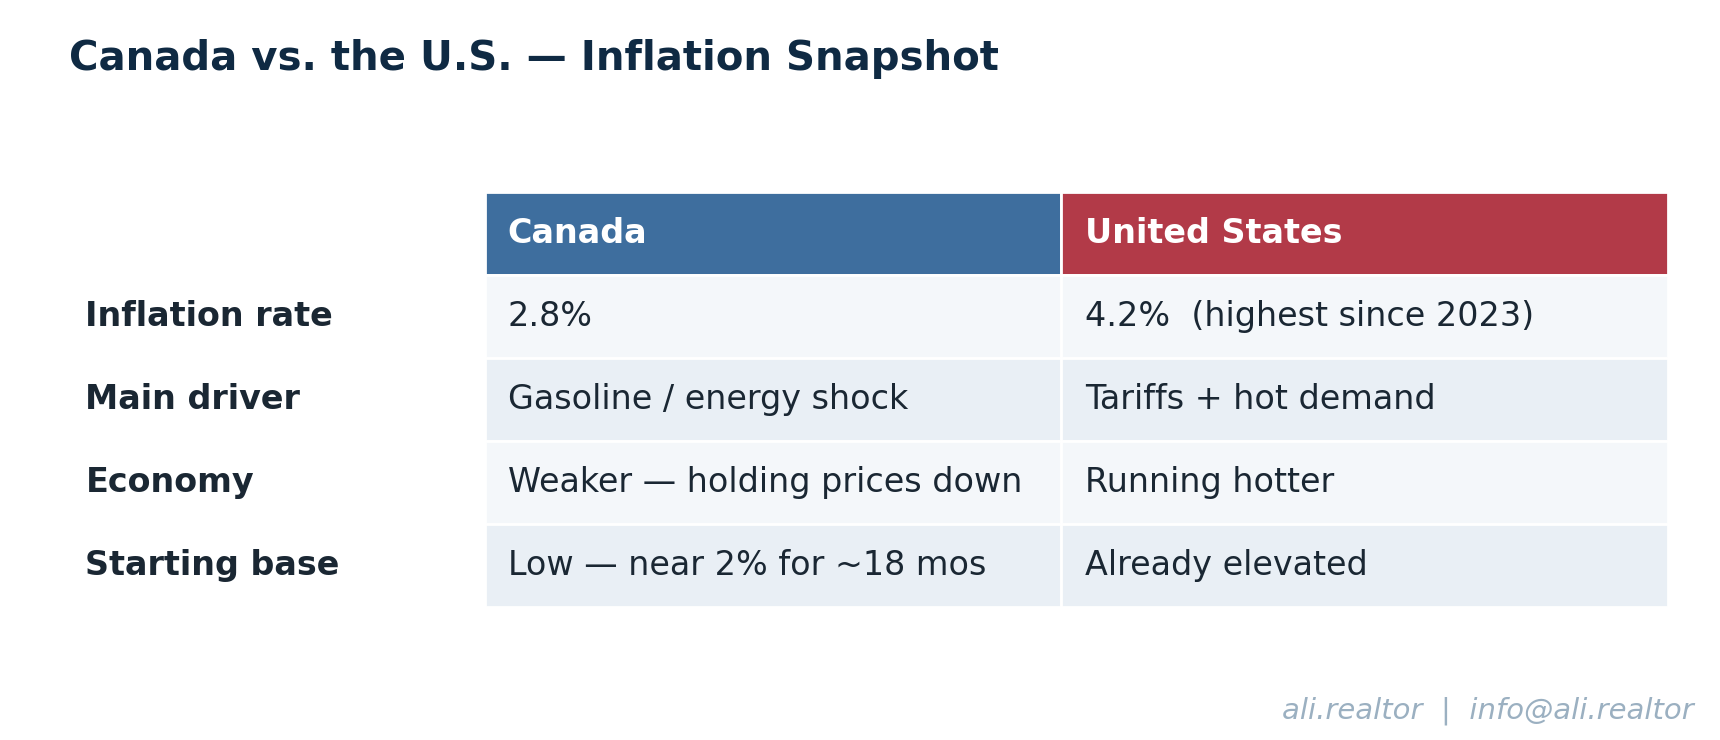
Canada is in noticeably better shape than its neighbour.

U.S. inflation hit 4.2% in May — its highest since 2023. A few things explain the gap: the U.S. economy has been running hotter (more demand means more price pressure), U.S. tariffs are directly adding to American inflation, and Canada started from a lower base, with inflation sitting near 2% for roughly 18 months before this energy shock.

The irony? Canada's weaker economy, painful as it is, is actually helping keep prices in check.


What Would Actually Force the Bank to Move

There are two clear triggers — and they pull in opposite directions.

Trigger #1 — A hike. If the Middle East conflict continues and energy costs start bleeding into broader inflation, the Bank has signalled rate hikes, potentially consecutive ones. Macklem was blunt: "We will not let higher energy prices become persistent inflation."

Trigger #2 — A cut. If U.S.–Canada trade negotiations break down and new tariffs land — and with CUSMA talks already tense, that's a real risk — the economic damage could justify cuts. A major tariff escalation hits exports, jobs, and business confidence quickly.

Here's the part that got buried in today's headlines: absent the war in the Middle East, the Bank would likely be cutting rates right now. The economy is weak enough to warrant it.

The energy shock is the only thing keeping cuts off the table — not because the economy doesn't need the support, but because you can't ease into an inflation problem at the same time. The war changed the entire conversation. Without it, we'd be talking about rate relief.


What the Markets Are Saying

Financial markets are currently pricing in roughly one quarter-point hike by the end of 2026. But many economists on Bay Street are more dovish:

  • CIBC expects no change in rates this year.

  • Capital Economics doesn't see the Bank moving in 2026 at all.

  • The C.D. Howe Institute called today's hold "the correct one" given the balance of risks.

Meanwhile, the 5-year Government of Canada bond yield — which directly drives fixed mortgage rates — dipped slightly after the announcement to around 3.13%. That modest decline reflects markets reading Macklem's tone as more cautious about the economy than hawkish about inflation.

Bottom line: markets see a possible hike this year. Economists are leaning toward a longer pause. Either way, the era of guaranteed cuts is over — and that changes how you should think about timing.


What This Means for You

Strip away the economist jargon and here's what today actually means depending on where you stand:

If you're buying: Waiting for "the perfect rate" is a strategy built on a forecast nobody at the Bank of Canada is willing to make. With cuts no longer guaranteed and a hike on the table, the cost of waiting may be rising — not falling. The smarter play is to get pre-approved now, lock in clarity on your numbers, and be ready to move when the right property appears.

If you're renewing or refinancing: That 5-year bond yield dip is worth a conversation. Fixed and variable are telling different stories right now, and the right choice depends entirely on your timeline and risk tolerance — not on a headline.

If you're selling: Rate uncertainty keeps some buyers on the sidelines, which makes pricing and positioning more important than ever. A well-prepared, well-marketed listing still moves; a hopefully-priced one sits.

The common thread? In a market this uncertain, the advantage goes to whoever has a plan for both directions — not whoever guesses right. Most agents will show you listings. What you actually need is someone who reads these signals weekly and helps you make the right call for your situation.


Let's Build Your Plan

If you're looking to buy, refinance, renew, or sell in this environment, it pays to work with someone who stays on top of these developments and can help you navigate the right move for your situation.

Book a 15-minute strategy call — I'll walk you through your options, no pressure, no jargon.

🌐 ali.realtor | 📧 [email protected]

Sources: Bank of Canada rate announcement (June 10, 2026); Bank of Canada Monetary Policy Report; CBC News; C.D. Howe Institute Monetary Policy Council. Market and inflation figures as of the June 10, 2026 decision and are subject to change. This article is for information only and is not financial advice.

Read

One Commercial Sector Just Jumped 232% and Most Investors Missed It

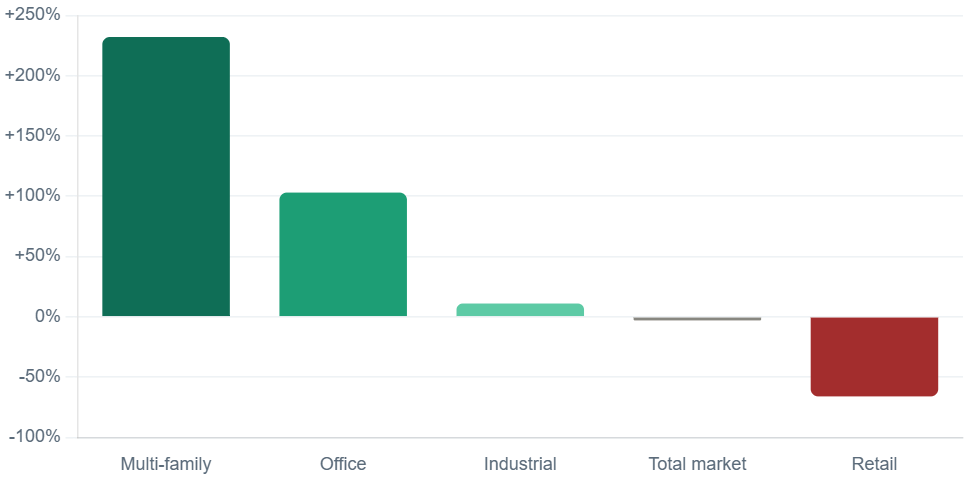
The short answer: In Q1 2026, GTA commercial investment held near $3.8 billion, down a slight 3% year over year. The headline hid the real story: multi-family residential investment surged 232% to roughly $675 million. While the market watched office vacancies, capital quietly moved into apartment buildings.

Headlines spent the quarter fixated on empty office towers. Meanwhile, the smart money was doing something completely different. It was buying apartment buildings, and it was buying a lot of them.

The Greater Toronto Area saw nearly $3.8 billion in commercial real estate transact in the first quarter of 2026. On the surface, that looks flat, a modest 3% dip from a year earlier. But underneath that calm number, one sector broke away from the pack in a way the broader market simply did not notice.

Where the capital actually went

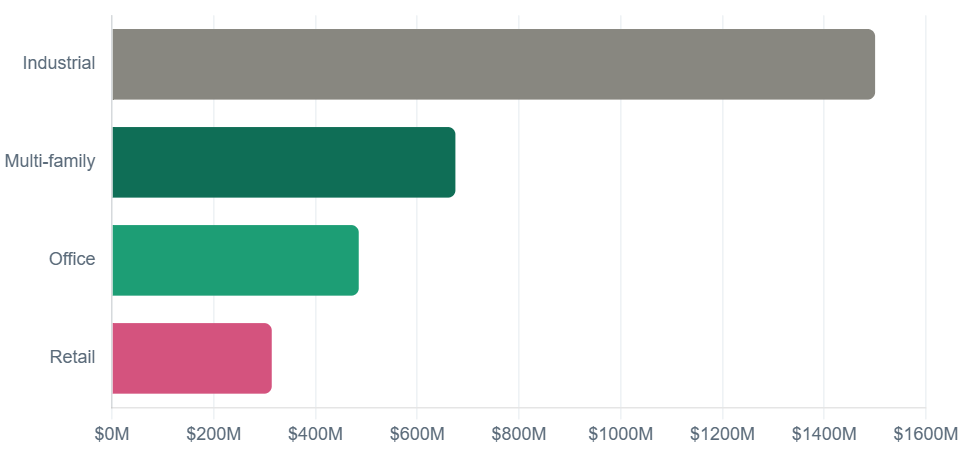
When you break the $3.8 billion down by asset class, the divergence is impossible to ignore. Multi-family did not just lead, it ran away with the quarter. Office posted a strong rebound off a weak base, industrial stayed dependable, and retail fell off a cliff.

It is worth separating the percentage growth from the absolute dollars, because they tell two halves of one story. A 232% jump sounds explosive, and it is, but multi-family is still a mid-size slice of total volume. Industrial remains the heavyweight by dollars. The point is the direction of travel: money is rotating toward rentals.

The numbers, side by side

SectorQ1 2026 volumeYear-over-year changeRead
Multi-family residential~$675M+232%Breakout
Industrial~$1.5B+11%Steady leader
Office~$485M+103%Rebound off lows
Retail~$314M-66%Sharp pullback
Total GTA commercial~$3.8B-3%Flat on the surface

Within multi-family, the growth was not evenly spread. Toronto and Halton drove the surge, with year-over-year investment activity climbing roughly 569% and 90% respectively as buyers and sellers found common ground on price and financing visibility improved.

Why investors are crowding into apartment buildings

This is not a fad or a one-quarter blip. Three structural forces are pulling institutional and private capital toward rental housing at the same time.

1. Rental demand is structural, not cyclical

Canada's housing shortage and immigration-driven population growth keep apartment units occupied almost regardless of the economic cycle. When a region needs more homes than it builds, every rental unit becomes a near-certain income stream. That is the kind of reliability institutions pay a premium for.

2. Cap rates reward scale

Prime GTA multi-family currently trades around a 3.5% to 4.5% capitalization rate, with the national average closer to 4.6% by the end of 2025. Those are tight, aggressive yields. They do not reflect weak returns, they reflect how badly large investors want stable, recession-resistant income. You do not see cap rates that low on assets people are unsure about.

3. It is a direct hedge against the for-sale slowdown

Here is the elegant part. When would-be buyers hesitate, and with the Bank of Canada holding its overnight rate at 2.25% in mid-2026 many still are, those people do not vanish. They rent. Multi-family captures that exact demand. The same hesitation that cools the resale market actively feeds the rental market. Owning apartments lets an investor sit on the right side of that trade.

MetricReading (mid-2026)What it signals
GTA multi-family cap rate~3.5% to 4.5%Strong institutional demand for the asset
National multi-family cap rate~4.6%GTA prices at a premium to the country
Bank of Canada overnight rate2.25% (held)Financing costs stabilizing, buyers returning

The lens that matters for private and mid-size investors

The lesson here is not "buy what the giants buy." Most private investors cannot write a cheque for a 200-unit tower, and chasing the exact same deals is a losing game. The real lesson is to understand why they are buying.

In a market like this one, durable cash flow beats speculative appreciation. The institutions piling into multi-family are not betting on prices spiking next year. They are buying income that shows up every single month, in good times and bad. That logic scales down. A well-located duplex, triplex, or small apartment building follows the same demand fundamentals as the towers, just at a size a private investor can actually own and operate.

The smartest moves right now are in assets people need, not assets people hope will rise. That is the lens I bring to every commercial conversation.

What this means for you

Buyers: Hesitation in the resale market is real, but it is also creating room to negotiate. With the Bank of Canada holding rates steady, financing is more predictable than it has been in two years. If you have been waiting for certainty, the picture is clearer now than at any point recently.

Sellers: If you own a multi-family or income-producing asset, you are holding exactly what the market wants most. Bid-ask spreads are narrowing and buyers are active. This is a window to test pricing from a position of strength, especially in Toronto and Halton.

Landlords: Structural rental demand is your tailwind. Occupancy is durable and the for-sale slowdown is funneling more renters your way. Focus on retention and unit quality now, because the demand backdrop supports steady, defensible rent.

Tenants: Competition for quality rentals will stay firm as buyers delay purchases and rent longer. Move decisively on units that fit, and lock in favorable lease terms early rather than waiting for supply to loosen.

Investors: Follow the logic, not just the headline. Prioritize durable cash flow over speculative upside, and look at small multi-family assets in the sub-markets where institutions are concentrating. The 232% surge is a signal of where stable income is being repriced, and you can participate at your own scale.


Thinking about a commercial or multi-family move?

I help private and mid-size investors read the GTA market the way institutions do, then act on it. Let us talk through where durable cash flow lives in today's numbers.

Visit The4Sale.com or reach me directly at [email protected]


Data sources: Altus Group Toronto Commercial Real Estate Market Update Q1 2026; Colliers GTA Multifamily Market Report Q1 2026; Cushman & Wakefield Canadian Cap Rates Report; Bank of Canada policy rate announcements. Figures are approximate and rounded. This content is for informational purposes and is not financial advice.

Read

March hinted at it. April confirmed it. May made it undeniable.

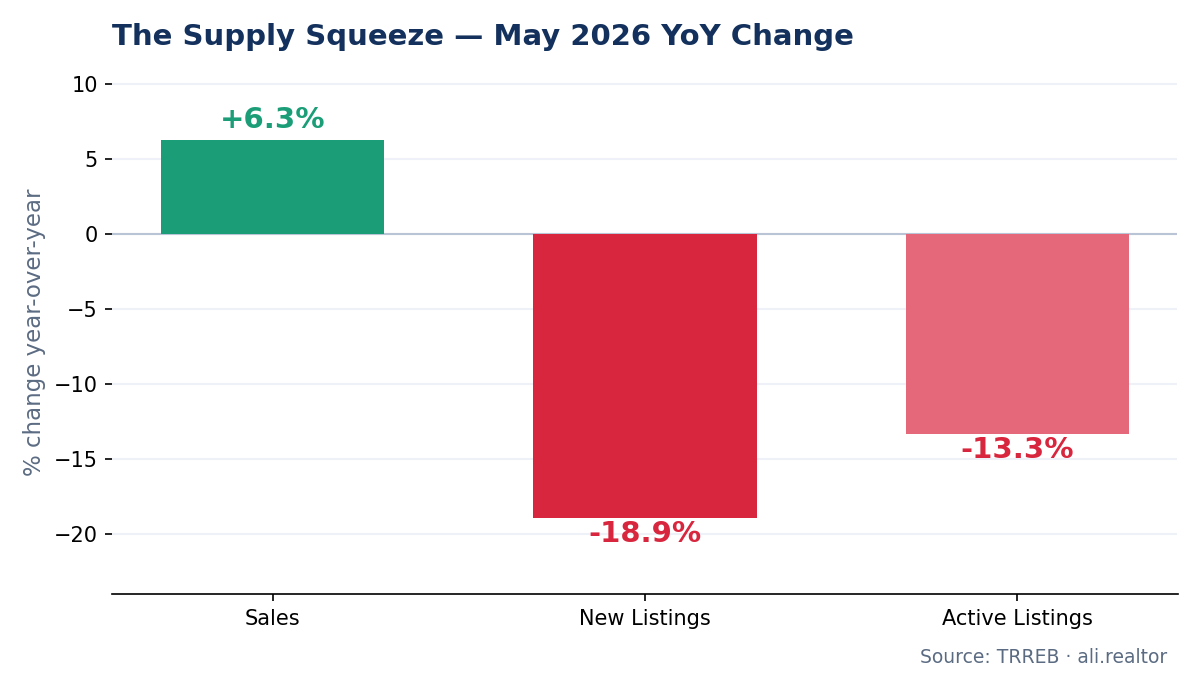
According to the latest TRREB Market Watch, the Greater Toronto Area resale market tightened sharply in May 2026: sales rose 6.3% year-over-year to 6,583, while new listings collapsed 18.9% to 17,698 — double April's rate of decline. On a seasonally adjusted basis, sales jumped 10% month-over-month and the average selling price ticked up versus April.

When sales grow and listings fall this fast, standing inventory gets absorbed, buyer competition intensifies neighbourhood by neighbourhood, and the price slide stops. Through the first five months of 2026, the GTA has recorded 24,405 total sales at a year-to-date average price of $1,032,238.

Here are the four numbers that define the month:

  • Sales: 6,583 (up 6.3% YoY)

  • New Listings: 17,698 (down 18.9% YoY)

  • Average Price: $1,069,700 (down 4.6% YoY)

  • Sale-to-List Ratio: 98%, with homes selling in an average of 27 days

"If sales strengthen further relative to listings, selling prices will level off and even start to grow as we move into 2027." — TRREB Chief Information Officer Jason Mercer


🏡 Detached Homes

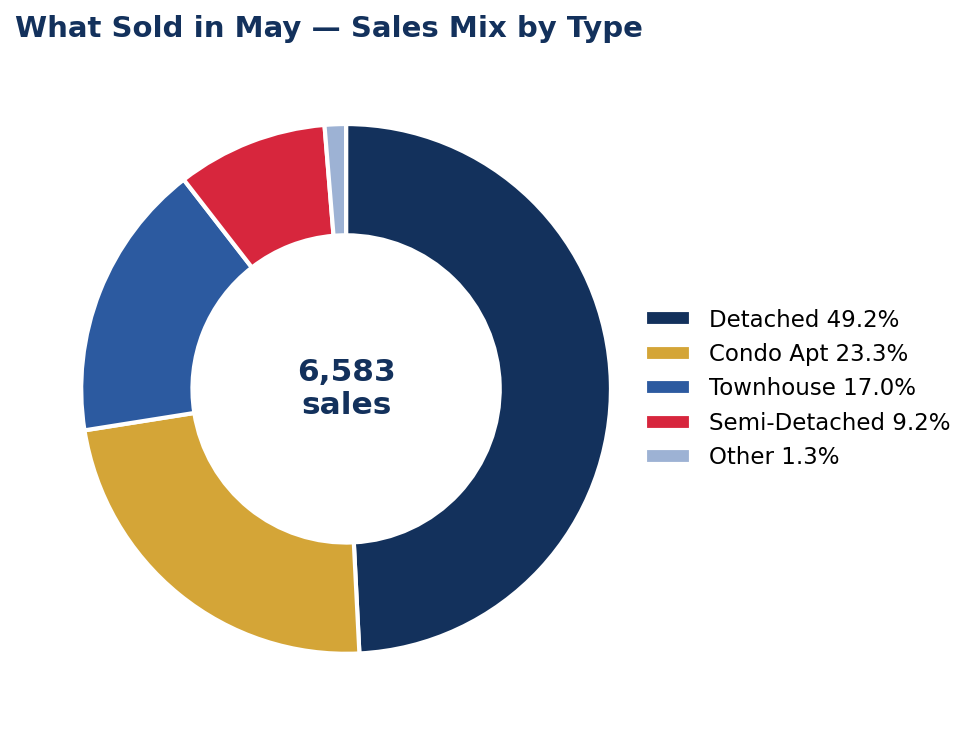
Detached homes led the market again, posting 3,236 sales (49.2% of all GTA transactions) and a 9.0% year-over-year sales gain — the broadest demand recovery of any property type, while prices remain below 2025 levels.

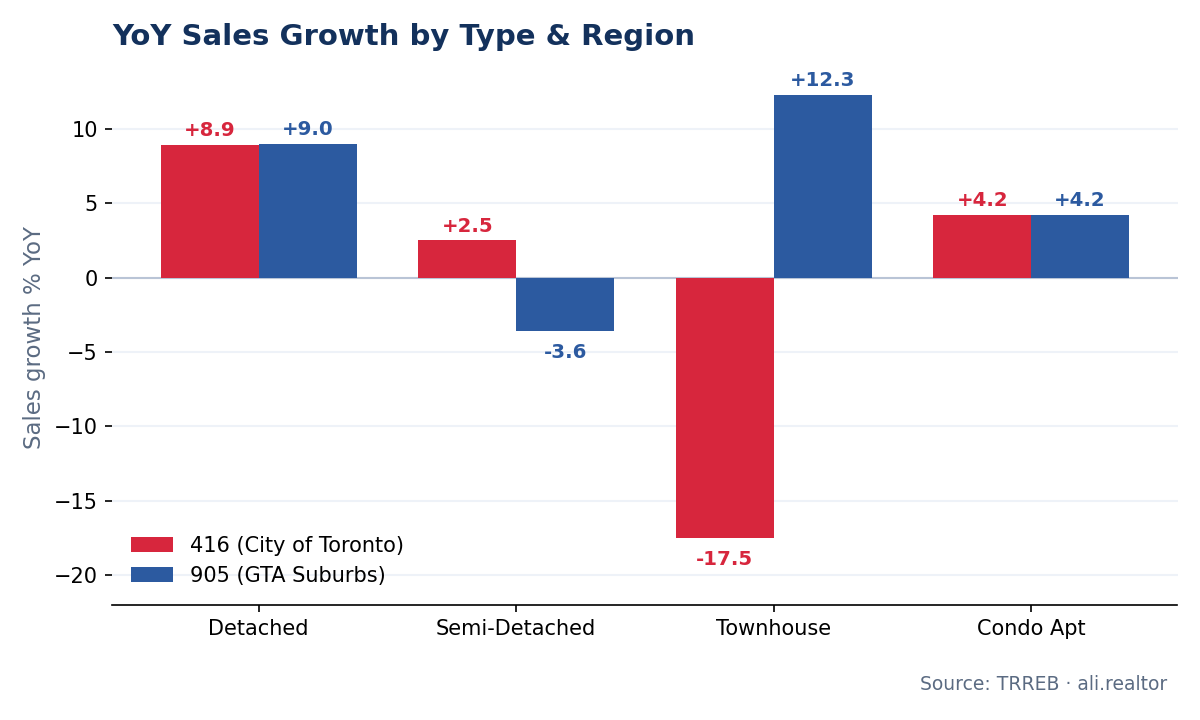
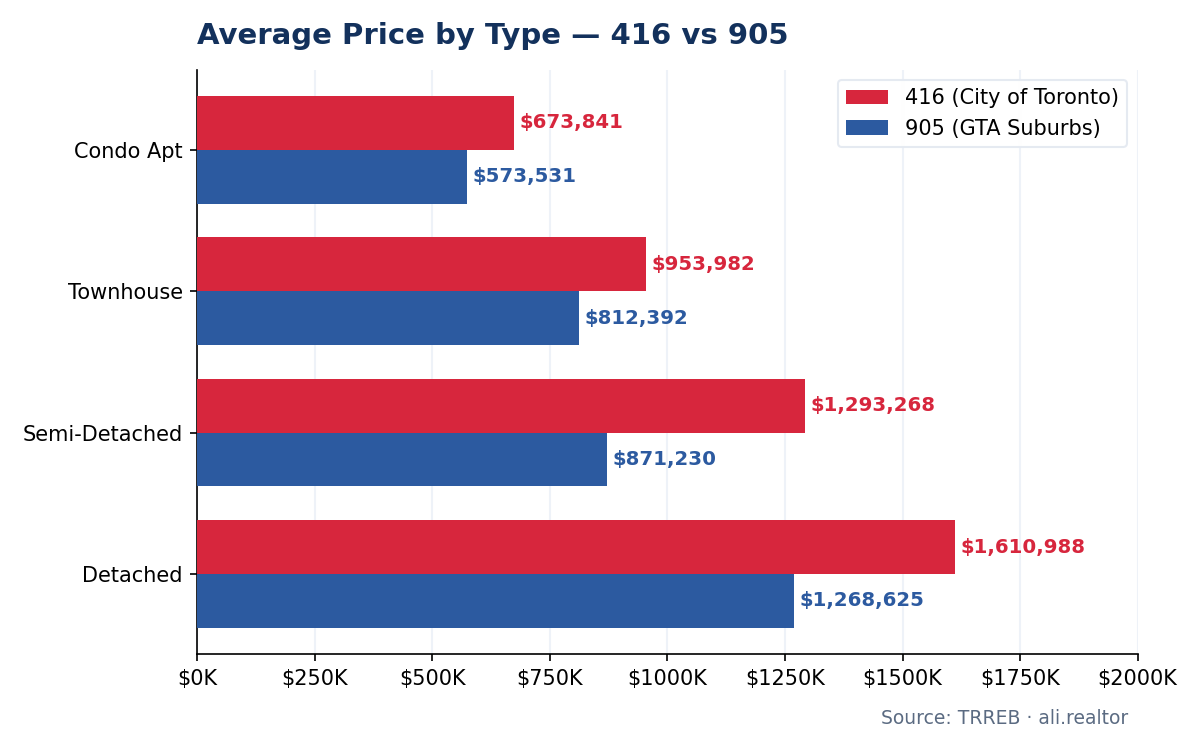
  • 416 (City of Toronto): 846 sales, up 8.9% YoY · Average price $1,610,988, down 6.5% YoY

  • 905 (GTA Suburbs): 2,390 sales, up 9.0% YoY · Average price $1,268,625, down 3.9% YoY

The take: A 905 price decline of just 3.9% paired with 9% sales growth means suburban detached has found its floor — and buyers are competing for it. For sellers who held off through 2025, listing into a market with 18.9% fewer competing listings is the strongest case in the cycle.


🏘️ Semi-Detached Homes

The "missing middle" produced 608 sales. The standout is the 416, where prices held essentially flat — the most price-stable segment in the entire GTA.

  • 416 (City of Toronto): 283 sales, up 2.5% YoY · Average price $1,293,268, down just 0.6% YoY

  • 905 (GTA Suburbs): 325 sales, down 3.6% YoY · Average price $871,230, down 6.7% YoY

The take: A 416 semi holding within 0.6% of last year while the broader market is down 4.6% is the scarcity premium reasserting itself — the city simply cannot build more of them. For move-up buyers who want city freehold without the detached price tag, act here first.

🏙️ Townhouses

Townhouses recorded 1,114 sales (17% of the market), split between attached/row (663 sales, avg $916,474) and condo townhouses (451 sales, avg $729,081)

  • 416 (City of Toronto): 222 sales, down 17.5% YoY · Average price $953,982, down 5.5% YoY

  • 905 (GTA Suburbs): 892 sales, up 12.3% YoY · Average price $812,392, down 6.6% YoY

The take: The 416 sales pullback is a supply problem, not a demand one — well-located city townhouses are scarce. The 905 is the volume engine, with 12.3% sales growth at accessible price points. Own a Toronto townhouse in Leslieville, The Junction, or Riverdale? You're listing into a starved market


🏢 Condo Apartments

Condos posted 1,535 sales, up 4.2% YoY and 23.3% of all transactions — the most accessible entry point into GTA ownership at an average of $639,468.

  • 416 (City of Toronto): 1,009 sales, up 4.2% YoY · Average price $673,841, down 5.0% YoY

  • 905 (GTA Suburbs): 526 sales, up 4.2% YoY · Average price $573,531, down 9.5% YoY

The take: The 905 condo segment — a 9.5% YoY price drop with rising sales — is textbook bottom-formation. With the Bank of Canada at 2.3% and new-listing supply collapsing, this is the alignment professional investors wait for. If you're positioning a condo for a 3-to-5-year horizon, the entry window is closing in real time.


🔥 GTA Hotspots: Where the Market Is Moving

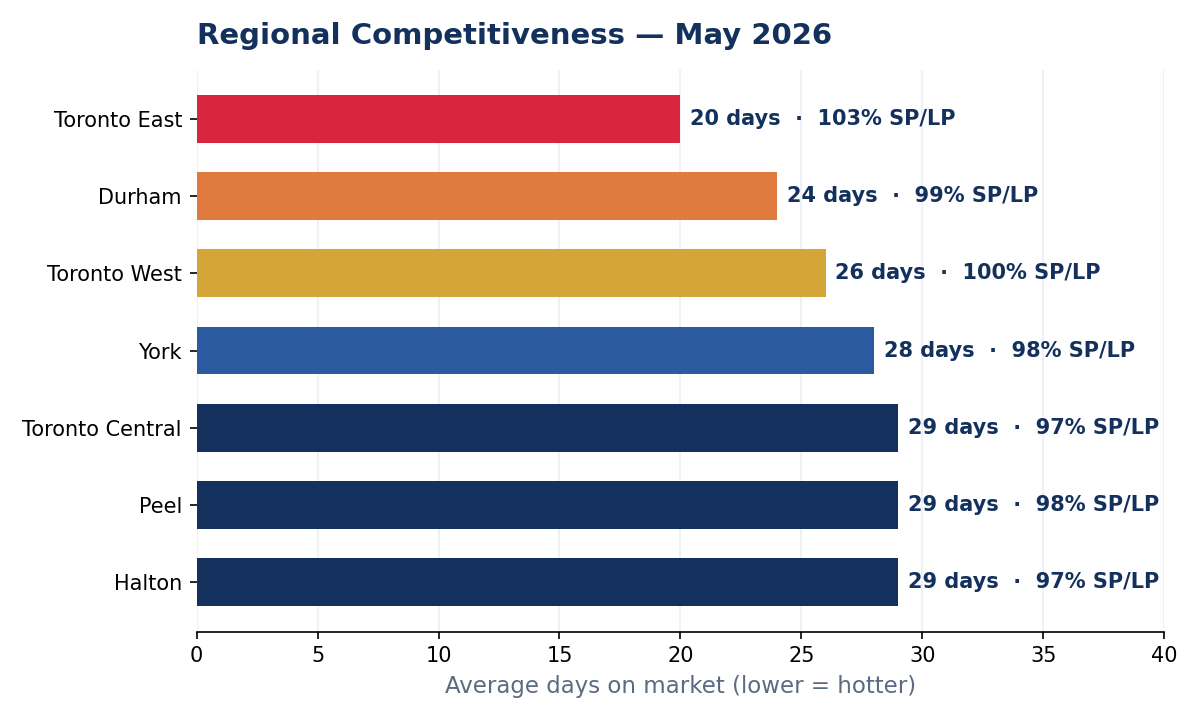
May sharpened the regional divergence. Toronto East is the fastest, most competitive submarket in the region — sellers there are routinely getting over asking.

  • Toronto East: 570 sales · 103% sale-to-list · 20 days on market (hottest in the GTA)

  • Durham Region: 804 sales · 99% sale-to-list · 24 days

  • Toronto West: 623 sales · 100% sale-to-list · 26 days

  • York Region: 1,183 sales · 98% sale-to-list · 28 days

  • Toronto Central: 1,184 sales · 97% sale-to-list · 29 days

  • Peel Region: 1,106 sales · 98% sale-to-list · 29 days

  • Halton Region: 816 sales · 97% sale-to-list · 29 days


📊 Economic Backdrop

The macro picture continues to support the shift: Bank of Canada overnight rate at 2.3%, prime at 4.5%, five-year fixed mortgages at 6.09%, and inflation at 2.4% — within target. The labour market stays soft, which is exactly why some would-be sellers remain on the sidelines and listings keep lagging sales.

"Spring sales have been stronger than last year, reflecting improved affordability from lower selling prices and borrowing costs. Sales are forecast to improve further as we move through the second half of this year." — Daniel Steinfeld, TRREB President


🎯 What This Means for You

If you're buying: The window of maximum opportunity is closing faster than a month ago. Prices are still below 2025, the BoC is at 2.3%, and supply is genuinely squeezed. TRREB is now forecasting price growth into 2027. The cost of waiting another quarter is now measurable.

If you're selling: You're in the strongest position since 2022. New listings are down 18.9% YoY, so well-priced, well-presented homes face dramatically less competition. The 98% sale-to-list ratio and 27-day average are all working in your favour. The spring window is wide open.

If you're investing: 905 condos — 4.2% sales growth at 9.5% lower pricing — are textbook bottom-formation. Rates are accommodative, supply is structurally constrained, and rental demand is robust. For a 3-to-5-year horizon, this is the entry environment investors wait years for.

Ready to Act on This Market?

The May 2026 data is unambiguous — the market has turned and the supply squeeze is accelerating it. Whether you're buying your first home, executing a strategic move-up, listing a property you've held for years, or building a portfolio, let's talk about exactly what this means for your timeline and your numbers.

📞 Call 416-886-2000 · ✉️ [email protected] · 🌐 Visit ali.realtor

Data sourced from TRREB Market Watch, May 2026 (released June 3, 2026). All figures represent Greater Toronto Area MLS® System activity.


Read

The signal is now unmistakable: the GTA market has turned. Buyers who waited for confirmation have it — and the cost of waiting longer is rising.

According to the latest TRREB Market Watch (released May 5, 2026), April 2026 delivered the clearest tightening signal we have seen in over a year. Sales jumped 7.0% year-over-year to 5,946 transactions, while new listings fell 9.3% to 17,097 and active listings dropped 6.4%. Most importantly: on a seasonally adjusted, month-over-month basis, the average selling price edged up versus March — the first directional reversal of the cycle. The MLS® HPI Composite was flat MoM. Prices may be finding their floor.

March hinted at it. April confirmed it. Sales are growing faster than listings, which is the textbook definition of a market shifting toward sellers. Through the first four months of 2026, the GTA has now recorded 17,862 total sales at a year-to-date average price of $1,018,849. Here is exactly where the market stands — and what every buyer, seller, and investor needs to do about it.


Detached Homes

Detached homes did the heavy lifting in April, posting 2,759 sales — 46.4% of all GTA transactions and a 9.2% year-over-year sales gain. This is the strongest segment-level demand recovery of any property type, and it is happening while detached prices remain meaningfully below 2025 levels. Buyers who priced themselves out in 2024–2025 peaks now have a viable runway back in.

  • 416 (City of Toronto)

    • Sales: 770 transactions in April 2026.

    • Average Price: $1,668,973.

    • Trend: Prices are down 1.9% year-over-year — the most resilient detached price performance of the cycle. Sales rose 6.6% versus April 2025. City detached has effectively bottomed.

  • 905 (GTA Suburbs)

    • Sales: 1,989 transactions in April 2026.

    • Average Price: $1,257,987.

    • Trend: Down 5.0% year-over-year on price — but sales surged 10.3%. Suburban detached buyer demand is now running at double-digit growth.

Insight: The 416 detached number is the one to watch. A 1.9% YoY price decline paired with 6.6% sales growth tells you the city's most coveted asset class is no longer correcting — it is rebuilding momentum. For sellers who held off through 2025, the case for listing now is stronger than it has been in 18 months. For buyers, the “wait for prices to fall further” thesis is officially expired.


Semi-Detached Homes

Semi-detached homes — the “missing middle” segment TRREB’s leadership has flagged repeatedly — produced 563 sales in April. The standout story here is the 416, where prices actually rose year-over-year. With YTD-2026 average semi prices crossing $1 million, this segment is quietly proving that scarcity wins.

  • 416 (City of Toronto)

    • Sales: 237 transactions in April 2026.

    • Average Price: $1,286,166.

    • Trend: Prices are up 1.5% year-over-year — the only major segment in positive YoY price territory. Sales eased 6.0% versus April 2025, but the price strength is the signal that matters: structural undersupply is reasserting itself.

  • 905 (GTA Suburbs)

    • Sales: 326 transactions in April 2026.

    • Average Price: $849,760.

    • Trend: Down 10.1% year-over-year on price — the steepest decline in the freehold market — with sales up a strong 5.5%. The buyer logic is clear: 905 semis under $850K are being aggressively absorbed.

Insight: 416 semis posting positive YoY price growth in this market is a structural story, not a fluke. The city cannot build them — they exist as legacy stock in established neighbourhoods. For move-up buyers who want freehold ownership in the city without the detached price tag, this is the segment to act on first. For sellers in 905 semis, the volume is there at the right price — pricing discipline is what unlocks it.


Townhouses

Townhouses recorded 985 sales in April 2026, split between attached/row-townhouses (566 sales, avg $939,197) and condo townhouses (419 sales, avg $704,847). Together, the segment represents 16.5% of all GTA transactions — and continues to attract the broadest buyer demographic, from young families to empty-nesters seeking ground-level living.

  • 416 (City of Toronto)

    • Sales: 230 transactions in April 2026.

    • Average Price: $958,029.

    • Trend: Prices are down only 5.9% year-over-year while sales jumped 12.2%. Toronto townhouses have now posted two consecutive months of double-digit sales growth — the most consistent demand recovery in the city.

  • 905 (GTA Suburbs)

    • Sales: 755 transactions in April 2026.

    • Average Price: $803,403.

    • Trend: Prices pulled back 9.0% year-over-year and sales slipped 2.5%. New-build townhouse supply continues to weigh on the resale market in select 905 pockets.

Insight: 416 townhouses are now officially the breakout story of spring 2026. Twelve percent sales growth signals city buyers have identified this as the value tier in an otherwise expensive market. If you own a properly-located Toronto townhouse — Leslieville, The Junction, Roncesvalles, Riverdale — you are in the strongest seller’s position you have been in since 2022. List with discipline; the buyers are there.


Condo Apartments

The condo apartment segment delivered the most dramatic shift of the month: 1,553 sales — up 9.1% year-over-year, representing 26.1% of all GTA transactions. With an average price of $635,653, the condo market remains the most accessible entry point into GTA homeownership — and after multiple quarters of price correction, the buying activity is finally catching up to the value.

  • 416 (City of Toronto)

    • Sales: 1,054 transactions in April 2026.

    • Average Price: $665,507.

    • Trend: Prices declined 6.4% year-over-year, but sales jumped 14.4% — the largest sales gain of any segment in the GTA. The reset is working. Buyers are returning at scale to the downtown and waterfront condo markets.

  • 905 (GTA Suburbs)

    • Sales: 499 transactions in April 2026.

    • Average Price: $572,594.

    • Trend: Down 7.5% year-over-year on price; sales essentially flat (-0.6%). 905 condo demand is stable, with sub-$600K product attracting first-time buyers priced out of freehold.

Insight: A 14.4% sales jump in 416 condos is the most decisive market signal in this report. After 18 months of correction, investor and end-user buyers have made their move. The Bank of Canada at 2.3%, condo prices roughly 15% off the 2022 peak, and a tightening listing environment is exactly the alignment professional investors wait for. If you are positioning a condo investment for a 3-to-5-year horizon, the entry window is closing in real time.


GTA Hotspots: Where the Market is Moving

April 2026 sharpened the regional divergence. Here is where buyer competition is most intense right now:

  • Toronto East (E01–E11): 546 sales | 102% sale-to-list ratio | Average 26 days on market. Toronto East remains the single most competitive submarket in the GTA. Sellers continue to receive over asking. Buyers in Leslieville, Riverdale, Beaches, and Danforth need to come prepared with strong, clean offers.

  • Durham Region: 708 sales | 99% sale-to-list ratio | Average 23 days on market — the fastest-moving region in the GTA. Ajax, Pickering, Whitby, and Oshawa are all running near 100% SP/LP, fueled by affordability advantages over Toronto and consistent commuter demand.

  • Toronto West (W01–W10): 717 sales | 100% sale-to-list ratio | Average 28 days on market. Pockets of intensity remain in W01 (Roncesvalles/High Park) and W02 (The Junction), with the broader west end showing balanced-to-firm conditions.

  • York Region: 964 sales | 98% sale-to-list ratio | Average 29 days on market. Markham, Vaughan, and Richmond Hill are seeing renewed move-up activity, with the highest-end submarkets (King, parts of Vaughan) showing the most price negotiation room.

  • Toronto Central (C01–C15): 1,049 sales | 97% sale-to-list ratio | Average 31 days on market. Still the most buyer-friendly submarket in the city — condo-heavy districts (C01, C08, C14, C15) continue to offer negotiating room. But with 416 condo sales up 14.4% YoY, that room is shrinking week by week.


Economic Backdrop

The macro backdrop continues to support the market shift. The Bank of Canada’s overnight rate is holding at 2.25%, with prime at 4.5%. One-year fixed mortgage rates are at 5.49%, three-year at 6.05%, and five-year at 6.09%. Inflation has ticked up modestly to 2.4% (March data) but remains within the Bank’s target band.

On the cautious side: GDP contracted 0.6% annualized in Q4 2025, Toronto employment growth was -0.3% in March, and the Toronto unemployment rate remains elevated at 8.1%. These pressures explain why a portion of would-be sellers are still on the sidelines — and why new listings have continued to lag sales growth. As TRREB Chief Information Officer Jason Mercer put it: “We still have a substantial amount of pent-up demand in the marketplace. More certainty on the trade front and an easing in geopolitical tensions would result in further improvements in market activity.”

Translation: when the trade and geopolitical fog clears, the next leg of demand — the one currently sitting on the sidelines — will hit a market that is already tightening. That is the setup buyers should be reading right now.


What This Means for You

If You Are a Buyer: The window of maximum opportunity is now actively closing. Sales are up 7.0% YoY, new listings are down 9.3%, active inventory is shrinking, and the average price ticked up month-over-month on a seasonally adjusted basis for the first time this cycle. The combination of lower prices than 2025, a Bank of Canada at 2.3%, and visibly tightening supply does not persist forever — and historically, conditions like this are followed by 6-to-12 months of price recovery. If you have been waiting for confirmation, this report is it. The cost of waiting another quarter is now measurable.

If You Are a Seller: You are in the strongest position you have been in since 2022. New listings are down 9.3% YoY, which means well-priced, well-presented homes are facing significantly less competition. The 98% overall sale-to-list ratio, 29-day average list-to-sale time, and tightening active inventory are all working in your favour. If you have been deferring a listing decision, the spring 2026 window is open right now. Pricing discipline still matters — buyers are informed — but the leverage has clearly shifted.

If You Are an Investor: The 416 condo segment posting 14.4% sales growth at 6.4% lower YoY pricing is the textbook bottom-formation pattern. The Bank of Canada has held rates accommodative, structural housing supply remains constrained (TRREB’s “Removing Roadblocks” policy report just released this month underscores how slow new supply moves), and rental demand fundamentals across the GTA remain robust. For 3-to-5-year horizons, this is the entry environment professional investors wait years for. Move with discipline — but move.


Ready to Act on This Market?

Whether you are buying your first home, executing a strategic move-up, listing a property you have held for years, or building an investment portfolio — the April 2026 data is no longer ambiguous. The market has turned. The question is what you do with that information.

I work with buyers, sellers, and investors across the GTA — from first-time purchases to complex multi-property transactions — and I am here to help you navigate this market with precision and confidence. Let’s talk about exactly what this data means for your specific situation, your timeline, and your numbers.

Data sourced from TRREB Market Watch, April 2026. Released May 5, 2026. All figures represent Greater Toronto Area MLS® System activity.

Read

New property listed in Toronto W04

I have listed a new property at 1784 Jane Street in Toronto. See details here

Location! Location! Location! With High Traffic Flow. Outstanding Mixed-Use Investment Opportunity. Solid Detached Building With Nearly 5000 Sq. Ft. Renovated Office/Living Space. This Versatile Property Is Ideal for Investors ,Entrepreneurs, Or end-Users looking To Capitalize On Strong Street Exposure And Multi -Use Potential. Former Usage Was A Restaurant With All Equipment Available, Which Could Be Utilized For Multiple Purposes Such As Restaurant, Office, Beauty Services And Many Retails , Etc. There Are 6 Total Parking 3 Tandem Parking Spaces At The Front. The Second Floor Features Two-2 Bedrooms Apartments And One-2 Bedroom In The Basement. Vacant Possession. EXTRAS 4 Hydro Meters. The Owner Presently Uses It For Office Purposes. All Restaurant Equipment Is Included. Equipment List To Be Provided.

Read

The $80,000 Phantom: Why Canada's Promised Secondary Suite Loan Vanished — And the 90% Refinance Plan That Quietly Replaced It

A Strategic Guide for GTA Homeowners Who Refuse to Be Left Behind


You Did Everything Right. So Why Are You Still Stuck?

You've watched your home appreciate for years. You've heard the headlines about Canada's housing crisis and "gentle densification." You've stood in your basement, or your backyard, and you've seen it — the second income suite, the in-law apartment, the laneway home — already finished in your mind.

Then in 2024, the federal government handed you what looked like the final piece: the Canada Secondary Suite Loan Program. Up to $80,000. Just 2% interest. A 15-year term. You started pricing contractors. You called your accountant. You opened a folder labelled "Suite Project."

And then... silence.

No application portal. No instructions. No phone number that worked. By the time the 2025 federal budget was tabled, the program had been quietly cancelled — buried in a footnote, never having helped a single Canadian homeowner.

If that sounds familiar, here's what you need to know: You are not behind. You were misled by a program that never existed. And the real opportunity — the one that's actually moving GTA homeowners forward right now — was hiding behind it the entire time.


The Real Villain in Your Story

Most homeowners assume the villain is the market. Or interest rates. Or contractor prices.

It's not.

The villain is misinformation — the kind that keeps capable, financially healthy people frozen in research mode while their equity sits idle and their adult children sleep in childhood bedrooms.

The good news? The program that absorbed it — the CMHC Refinance Program — is, by nearly every measurable standard, more powerful than what was originally promised. You just have to know how to use it.

That's where this guide comes in.


Meet Your Plan: The CMHC Refinance Program

Here's what most homeowners don't realize. The CMHC Refinance Program doesn't just lend you money to build a suite. It lets you refinance against your home's future value — the value it will have after the suite is built.

Read that again.

You're not borrowing against what your home is worth today. You're borrowing against what it will be worth once the project is done — up to 90% of the post-construction value, capped at $2 million.

That single mechanic changes everything.

This is the bridge most Toronto homeowners didn't know existed.


The Three Authority Signals: How Lenders Read You

Cialdini taught us that authority cuts both ways. The bank wants to know you are credible too. Under CMHC's framework, that credibility is measured by three numbers — and if you know them in advance, you can fix what needs fixing before you apply.

You also need to be a Canadian citizen, permanent resident, or non-permanent resident with valid work authorization — and you (or a spouse, common-law partner, parent, or child) must actually live in the home.

This is not a program for absentee investors. This is a program for people building a future on land they already stand on.


CMHC vs. Cash-Out Refinance: The Comparison Most Lenders Won't Make For You

Here's where most homeowners get quietly steered the wrong way. A traditional cash-out refinance is easier for a lender to process — so it's often the first option suggested. But for a secondary suite project, it's almost always the worse option.

CMHC vs. Cash-Out — The Honest Comparison

FeatureCMHC RefinanceConventional Cash-Out
Equity You Can AccessUp to 90% of post-construction valueUp to 80% of as-is value
Amortization30 years25 years
Interest RateOften lower (CMHC-insured)Standard market rate
Best ForBuilding a secondary suiteGeneral cash needs

For a Toronto property where post-construction valuation can rise meaningfully — say, a Scarborough bungalow with a finished basement suite, or an East York semi with a laneway home — that 10% gap between 80% and 90% can be the difference between "someday" and "this year."


The 5-Step Plan: From Idea to Approval

This is where most articles end. This is where the real work begins. Here is the plan, in the order it actually happens.

A few things worth absorbing:

  • CMHC must approve the financing before construction starts. This is non-negotiable. Build first and you forfeit the program entirely.

  • Funds advance in stages. Not all at once. As each phase of the build is completed, the next tranche releases. This protects everyone — including you.

  • Not every lender is approved. Many mortgage brokers don't even mention this program because they don't have the relationships to execute it. The right professional makes this fast. The wrong one stalls you for months.


What Your Suite Must Be (and What It Cannot Be)

The suite has to qualify as a true secondary residence. That means:

  • A separate kitchen. Not a kitchenette. Not a microwave on a counter.

  • A separate bathroom. Full, functional, private.

  • A distinct living space. Suitable for full-time, year-round occupancy.

  • A private entrance. Independent access, separate from the main home.

  • Compliant with local bylaws and Ontario building code. Every line.

  • Rented for a minimum of 90 consecutive days if you choose to rent it. No short-term rentals. No Airbnb. No exceptions.

If your plan was to build a suite and rent it on Airbnb, this program is not for you. If your plan was to build something a parent, a child, or a long-term tenant could call home — this program was practically written for you.


The Cost of Waiting (And Why Smart Owners Are Moving Now)

Brian Tracy taught a principle that I think about often: the law of correspondence. What's happening on the inside — the hesitation, the second-guessing, the "I'll look into it next quarter" — almost always matches what shows up on the outside: equity sitting idle, family arrangements unsolved, opportunities passing.

Here is the honest math of waiting in 2026:

  • Construction costs in the GTA are still climbing, roughly 4–6% annually. The suite that costs $180K today is closer to $190K next year.

  • Mortgage rates remain volatile. The window for a favourable refinance is not permanent.

  • Municipal permitting timelines have lengthened, particularly for laneway and garden suites in Toronto. The earlier you start the paper trail, the earlier you finish.

  • Rental demand in the GTA continues to compress vacancy rates. Every month your suite isn't built is a month of foregone income.

The homeowners who started planning in late 2025 are pouring foundations now. The ones who waited for "more clarity" are still researching.


The Truth About Going It Alone

You can absolutely manage this process yourself. Many homeowners do. But understand what that means: you'll need to identify a CMHC-approved lender, coordinate two appraisals, manage permit timelines, vet contractors, structure the financing, and ensure every document aligns with CMHC's specific requirements — all while still working your full-time job and running your household.

Or, you can work with a Toronto real estate professional who has done this dozens of times — who knows which lenders move quickly, which contractors specialize in secondary suites, which neighbourhoods are seeing the strongest post-construction valuations, and which permit pathways are currently the fastest.

The choice isn't between "expensive" and "cheap." The choice is between months of confusion and a clear path forward.


Your Next Move

You came to this article looking for clarity on a federal program that no longer exists. You're leaving with something better: a working knowledge of the program that does, the framework to qualify, and the plan to execute.

But information alone doesn't build a suite. Action does.


🔑 Book Your 2026 Secondary Suite Strategy Session

A private, no-obligation 30-minute consultation where we will:

✅ Review your specific GTA property and its post-construction potential
✅ Identify the right financing path (CMHC, HELOC, or hybrid) for your numbers
✅ Connect you with a CMHC-approved lender who actually knows this program
✅ Map out a realistic 90-day action plan you can start this week

Spaces are limited to 6 consultations per month so I can give each property the deep attention it deserves.

[ → BOOK MY SECONDARY SUITE STRATEGY SESSION ]

Disclaimer: This article is for informational purposes only and does not constitute financial, legal, or tax advice. Program details are based on publicly available information from the Canada Mortgage and Housing Corporation as of 2026. Always consult with a qualified mortgage professional, financial planner, or accountant before making refinancing decisions. Source reference: blog.remax.ca, "Financing for Secondary Suites in Canada," March 2026.

Read

The Bank of Canada Holds at 2.25%: What Every GTA Seller, Buyer, and Investor Needs to Know Today

April 29, 2026 | Ali Bolourchi — The Visionary Curator


Today the Bank of Canada did exactly what most economists expected: nothing. The overnight rate stays at 2.25%, held for the third consecutive time in 2026. But beneath that quiet headline, a much bigger story is unfolding in the Canadian housing market. One that will reshape who can afford what, who decides to sell, and who finally pulls the trigger on a purchase.

If you own property in the GTA, are thinking of listing, or have a mortgage coming up for renewal, this decision matters — more than the headline suggests.


Why the Bank Held — And Why It's More Complicated Than It Looks

The Bank of Canada isn't holding rates because the economy is in great shape. It's holding because it's caught between two competing forces pulling in opposite directions:

Inflation came in at 2.4% in March — up sharply from 1.8% in February — and the Bank is already warning it could climb to around 3% in April. Much of that pressure is coming from energy costs tied to the ongoing conflict in the Middle East, which has disrupted supply chains and pushed oil prices higher. At the same time, U.S. tariff uncertainty is weighing on Canadian exports and business investment, acting as a brake on growth. GDP is forecast at just 1.2% for 2026 — cautious, not confident.

Cut rates, and you risk feeding inflation further. Hike rates, and you risk choking an already fragile recovery. So the Bank sits still — and watches.

A Reuters poll of 41 economists found 100% expected today's hold, and 80% believe rates won't move for the rest of 2026. But a minority are pricing in two quarter-point hikes — possibly in September and December — if inflation proves stickier than the Bank expects.

The Renewal Wave: The Real Story Behind Today's Decision

Here's what makes this particular rate hold so consequential: approximately 60% of all outstanding Canadian mortgages are renewing in 2025 or 2026. In 2026 alone, roughly 1.2 million fixed-rate mortgages — representing over $300 billion in debt — are hitting renewal.

These are homeowners who locked in when the overnight rate was near zero and 5-year fixed rates sat between 1.5% and 2.5%. They are now renewing into a world where the best available 5-year fixed rate is 4.04% through a broker, or 4.29% at a major bank. The lowest 5-year variable is around 3.35%.

The financial impact, what analysts are calling "payment shock", breaks down roughly like this: the majority of 5-year fixed renewers will see monthly payments rise by an average of 20%. For a $750,000 mortgage, that's an additional $400–$600 every single month. The hardest-hit 10% of borrowers will see payments jump by more than 40%. The silver lining belongs to variable-rate holders, who may actually see a modest 5–7% decrease.


What This Means for GTA Sellers

The rate hold is a quiet opportunity — but only for sellers who treat it that way.

Stable rates give buyers a clearer picture of what they can afford. The "what if rates spike again?" anxiety fades, and fence-sitters begin to move. That's good for sellers. What's less good: inventory has been building steadily in the GTA through early 2026, giving buyers more choices and more leverage than they've had in years.

In this environment, the homes that sell — and sell well — are not the ones that are simply listed. They are the ones that are curated, priced with precision, and presented as a lifestyle rather than a property. The renewal wave is also quietly adding supply: homeowners who can't absorb a $500/month payment increase at renewal are starting to list. Your competition is growing.

The sellers who will win in this market are those who come in prepared and presented. Not those who "test the water" with an aspirational price and hope the market comes to meet them.

The seller's checklist right now:


What This Means for GTA Buyers

Today's hold is quietly good news for buyers — even if it doesn't feel that way yet.

Rate stability means your pre-approval holds its value. You can model your payments with confidence. And the inventory that has accumulated in the GTA gives you something that was almost impossible to find two years ago: genuine choice and real negotiating power.

Variable rates deserve serious consideration right now. At 3.35% for a 5-year variable, buyers comfortable with some flexibility are accessing meaningfully lower payments than fixed-rate options — and if the Bank holds through the year as most economists expect, that advantage compounds.

The window is real, but it's not guaranteed to stay open. If inflation persists and the Bank does move in the fall, the affordability equation shifts again. Buyers who act in Q2 and Q3 2026 are buying into relative clarity. Buyers who wait for the "perfect" rate may find the window has closed.

This is the market where you negotiate conditions, price, and closing terms. Use it.


What This Means for GTA Investors

Investors need to run the numbers — honestly — before making any move.

The renewal math is brutal for properties financed at pandemic-era rates. A rental that cash-flowed at 2% needs to be stress-tested at 4%+. If it doesn't work on paper today, holding and hoping isn't a strategy.

The condo market in the GTA deserves particular scrutiny. TD Economics has flagged it as facing continued headwinds — oversupply, softening rents in some pockets, and price stagnation. If your exit strategy was "sell into a rising market," it's time to reassess whether that market exists right now for condos.

Where genuine opportunity lies: the renewal wave is creating motivated sellers — homeowners who need to transact, not those who simply want to. Freehold properties in established GTA neighbourhoods continue to hold value better than the condo segment. Investors with dry powder and patience are entering the best buying environment in years.

The long-term case for GTA real estate — population growth, immigration, chronic undersupply — hasn't changed. But short-term decisions need to be made on current data, not long-term faith.


The Bottom Line

The Bank of Canada's decision to hold at 2.25% is not a green light or a red flag. It's a pause — a moment of unusual clarity in an otherwise volatile economic picture.

For the GTA real estate market, the real story isn't the rate decision itself. It's what's happening beneath it: a massive renewal wave is quietly forcing decisions, adding inventory, shifting buyer calculus, and creating opportunities for those who are paying attention.

The sellers who read this market correctly will price with discipline and present with intention. The buyers who read it correctly will act with confidence rather than waiting for a rate that may never arrive. The investors who read it correctly will make decisions rooted in today's numbers — not yesterday's optimism.

If you want to understand exactly what today's announcement means for your specific situation — whether you're listing, buying, or stress-testing a portfolio — I'm here.

Ali Bolourchi | The Visionary Curator | [email protected]

Sources: Bank of Canada, TD Economics, CMHC, BNN Bloomberg, Nesto, RBC, Reuters

Read
This website may only be used by consumers that have a bona fide interest in the purchase, sale, or lease of real estate of the type being offered via the website. The data relating to real estate on this website comes in part from the MLS® Reciprocity program of the PropTx MLS®. The data is deemed reliable but is not guaranteed to be accurate.